![GreenPort[PortStrategy]](https://www.portstrategy.com/greenport/wp-content/uploads/sites/4/2026/09/GreenPortPortStrategy.svg)





Both art and science
Conference bans have led to growth in demand for consultants, finds Michael King
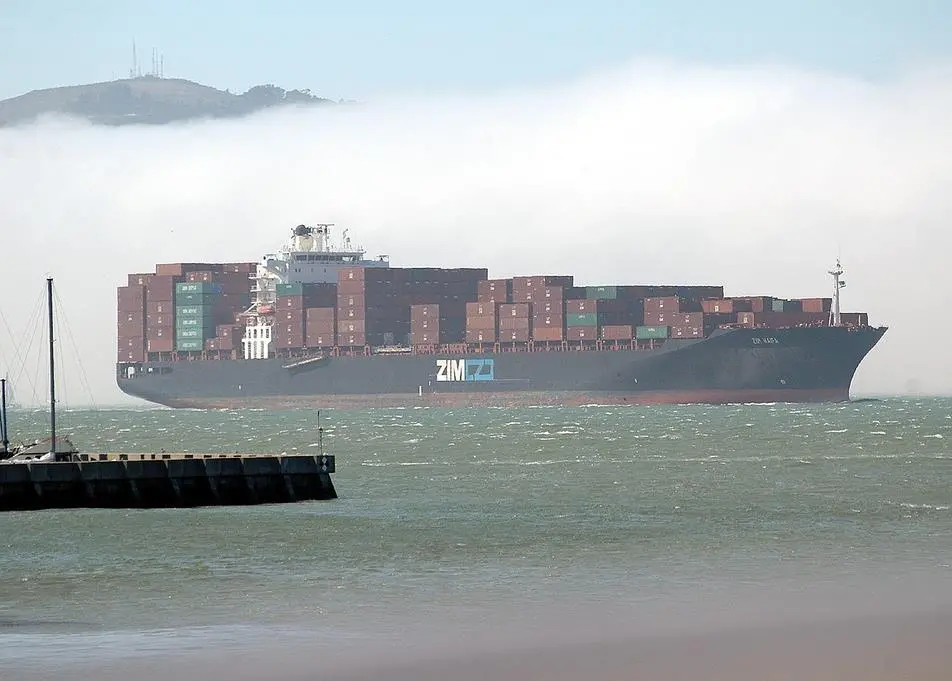
With their opinions often used to support multi-million dollar business decisions, analysts that forecast port and shipping demand tread a very fine line – predict the next ‘perfect storm’ and relative fame beckons; get it badly wrong and memories are long.
Yet the information available to those that call forward markets is always imperfect, both at the macro and the local level. As a result, even with the most sophisticated number-crunching and refined methodology, industry experience and gut instinct remain key adornments to the forecasting oeuvre.
“Forecasting is as much an art as it is a science,” says Daniel Hackett, partner at Hackett Associates which produces the Global Port Tracker container trade forecasts. “The global economy is simply too complex and interconnected to be able to forecast perfectly. Having said that, forecasts have greatly improved in accuracy, in large part because of the greater availability of information that we can use to drive our forecasts.”
Drewry’s Neil Davidson believes forecasting is a combination of robust quantitative analysis and judgement based on experience and industry knowledge. “While the numbers generated are of course important, as important in our view is helping our clients to understand the drivers and factors influencing the forecast, and to consequently be able to make an informed view on the risks and opportunities,” he explains.
In the container business, analysts, consultants and information outlets have become more influential since lines were forced to limit their co-operation on pricing and capacity after shipping conferences were banned on routes to and from Europe in 2008.
News channels
The head of logistics at one of the world’s biggest fast-moving cosumer goods’ shippers recently told Port Strategy that the supply and demand forecasts of analysts, and how that information was then released via media to customers and competitors, had become the most effective means by which lines could understand the pricing and capacity strategies of competitors, and legally communicate with each other.
“I don’t believe in the smoke filled room, carriers have everything to lose if they were ever caught doing that,” he said on condition of anonymity. Carriers tell each other what they’re going to do on the front pages now. That’s how they communicate their intentions.
“They can’t ignore what their competitors are doing on price and capacity. It’s all out there in the open and shippers can see it. That’s why we all subscribe to the major titles and analytical publications.”
For the forecasters themselves, the first step when starting to produce a demand forecast for container trades or for a specific port or region, is to examine the macroeconomic parameters within which shipping demand will fluctuate over various time frames.
Demand factors
GDP is the primary factor Drewry considers when looking at the main drivers of consumer demand and, therefore, short and long-term container growth trends, according to Mr Davidson. Secondary factors taken into account include outsourcing trends, foreign direct investment, population growth, consumer trends and affluence.
“In the short term, lead indicators such as purchasing managers indices are also important,” he adds. “The sources for the data are varied and include, for example the International Monetary Fund. However, it is rare for any of these sources to produce long term forecasts of, for example, GDP, so we have to model this ourselves, usually using several scenarios.
“Overlaid on these macro-economic factors are shipping issues such as transhipment, container penetration of the general cargo market and empties.”
Hackett Associates’ forecasting models utilise a number of economic indicators, but the primary focus is on national level purchasing manager indices and national level industrial output. “We find these to be strong forward indicators,” says Mr Hackett. “We keep an eye on the various GDP forecast estimates released by the IMF, OECD, and World Bank, but use those more as guidelines.
“We also keep an eye on consumer spending and consumer sentiment, both of which are obviously closely tied to how much retailers will need to resupply their shelves.”
Drill down
Trying to apply these overarching macroeconomic and shipping trends into analysis that is relevant to individual trades or specific ports further raises the forecasting difficulty stakes.
At the port level, Drewry models the market share of individual ports and terminals based on a forecast of capacity development, utilisation levels, plus consideration of the relative competitive strengths and weaknesses or each port and terminal. “This would include taking into account the ability to physically accommodate ship sizes for example, tariffs and service levels, inland connectivity as well as considering the likely competitive behaviour of the main market players – the terminal operators,” says Mr Davidson.
“In the short term, we would also consider any contractual issues – that is, if any particular shipping line or alliance has a multi-year contract with a particular terminal. For transhipment it is necessary to look at the current and likely future network strategy of each carrier or alliance.”
Hackett Associates takes a similar approach.
“Our forecasts are often based on trade lanes, which we then apply to specific ports based on their trade patterns and seasonality,” says Mr Hackett. “We forecast at the port level rather than the terminal level.”
Outside influence
Other factors taken into considerion when looking to the long-term also include maritime regulations, ship designs and, in the US, allocation of Federal funds to assist with redevelopment projects, especially in light of the Panama Canal expansion and the deeper draft ships it will bring from 2015.
“For the most part, though, policy events are not directly factored into the model, they’re factors that we are aware of that guide the overall forecasts,” says Mr Hackett. “For the most part we assume that capacity at a port will meet demand.
“A much bigger factor is when line strategies lead to a shift from one port to another – such as the Grand Alliance shift from Seattle to Tacoma earlier this year – and you can’t really model those until the announcements are made.”
The analysis involved in forecasting demand for container handling and trade are highly complex, but in many respects some bulk trades are even more difficult to breakdown accurately due to the multiple tangible and intangible variables at play.
US-based Informa Economics offers energy, industrial products, commodities and crop and livestock supply and demand analysis. The grain side of the business covers North American bulk ports, shipping on the Mississippi River System and US and global crop supply and demand. Forecasts take in a mass of variables from price outlooks and transportation and storage projections, to weather forecasts, agricultural policy and farm programs.
“Research is underpinned by a thorough understanding of production and usage for the US and the world, with fundamental factors incorporated into analysis and price forecasts,” says Ken Eriksen, who heads up IE’s Transportation, Industrials and Energy services group.
“US and world production forecasts are based on Informa Economics’ own survey of acreage and yields, with production prospects in other countries are assessed through travel by our personnel and extensive contacts around the world.” IE’s demand forecasts are then calculated based on domestic consumption by individual countries, then expanded into detailed projections of trade flows.
Starting supply
However, Mr Eriksen says the forecasting process really begins with the supply side of the equation. “A supply of grain and oilseeds is first needed to develop the demand impact,” he explains. “The process of growing a crop is not a guaranteed event; there are too many variables that impact crop potential from getting the seed in the ground, to having the plant emerge, to having adequate moisture and heat to grow the crop, and to harvest the crop.”
A larger supply leads to lower prices and higher demand as a result, while conversely a smaller supply leads to higher prices and lower demand. This happens within an environment in which global appetites for a steady supply of grains and soybeans are expanding each year, especially throughout Asia. “So, when one region of the world, for example North America, has difficulties growing a crop that leads to subsequent smaller supplies, other regions – for example South America – will step up to plant, treat the crops grown and expect to harvest larger crops in response to higher prices because of the smaller supply,” he explains.
“Production agriculture is an annual event and highly dependent on weather. So, predicting weather and its patterns regarding how wet or dry, hot or cool it will be, is the challenge in forecasting the supply that will be available to meet global demand.”
IE also analyses the grain trade in North America via individual ports and by specific trade routes or modes which take into account an even more diverse range of variables. “Regarding export by port methodology, we use a process that includes many drivers and factors such as landed cost analysis taking into account inland freight costs, handling charges and origin prices, then ocean freight rates,” says Mr Eriksen.
“The origin price and inland transport costs have a number of functions including the amount of available grain supply available for the various market channels.”
With so many variables at play, including the weather, there is ample scope for even the best analysis to be thrown off target.
Related Articles
 CONTAINER & CARGO HANDLING
 CONTAINER & CARGO HANDLING