
Managing air quality at Port of Oslo
For the first time in 2014, the Port of Oslo carried out a comprehensive emission inventory for air pollution applying international methods based on bottom-up approach including all air emission activities connected to oceangoing vessels (OGV), harbour vessels (HV) and shore, writes Heidi Neilson, head of environment, Port of Oslo, Norway.
Bridging port and city
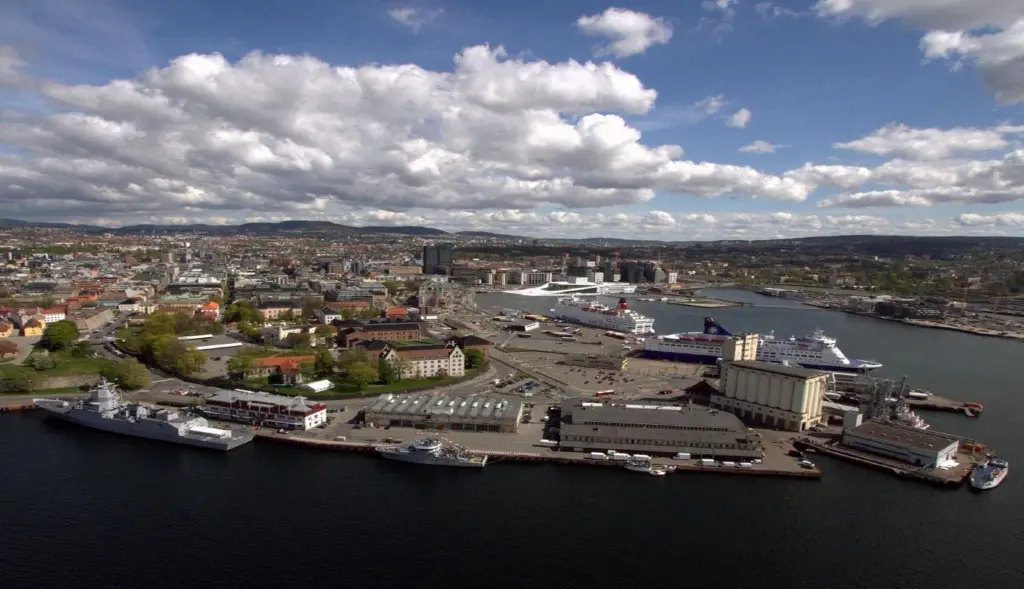
The port is a part of the city so the aim behind putting together the inventory was to gather facts regarding the emissions from the port area, share information and knowledge and open a dialogue to include stakeholders.
By conducting this process there is the potential to learn a lot, create understanding and possibly find a common strategy to make actual air quality improvements.
Public health is the number one priority when it comes to air pollution. Around 50,000 deaths are thought to have been caused by air pollution in Oslo over a period of ten years (Source: Report from Norwegian Institute of Public Health, Norwegian Public Roads Administration and University of Oslo – Faculty of Medicine).
A collaboration
The Port of Oslo has around 50 to 60 calls per week and more than 3000 calls annually. This equates to 6m passengers per year in terms of cruise and 212,000teu annually for container handling.
Based on a collaboration with the city of Oslo for mapping the total emissions for the city of Oslo in 2013, figures showed that the Port of Oslo emitted 9% of NOx to the city of Oslo while the road traffic from the city stood at 82% for NOx emissions. PM10 emissions from the Port of Oslo to city of Oslo was found to be insignificant.
By performing model runs, the Port of Oslo was able to assess the air pollution contributions from its activities to the city of Oslo to help with developing a sustainable mitigation action plan for reducing air pollution.
Scenarios up until 2020 were simulated with different mitigation measures to predict future impact of air pollution from the port to the city based on the Port of Oslo business outlook from 2013 to 2030.
Why an inventory?
In 2014, Port of Oslo decided to perform a detailed and comprehensive air quality mapping and assessment as part of its ongoing environmental focus and commitment strategy.
To gain knowledge about the reduction of SO2 due to the new Sulphur Emission Control Areas (SECA) directive which took effect on 1 January 2015, the inventory was an important task to undertake as part of the overall air quality management strategy at the port.
Another important reason for the inventory was the collaboration with the city of Oslo in identifying hotspots and measures on how to reduce air pollution in the city.
In November 2013, the EFTA Surveillance Authority delivered a letter of formal notice to Norway for non-compliance with limit values for NO2, PM10 and SO2.
As part of the action plan from the city of Oslo, Oslo Municipality, Bærum municipality and Norwegian Public Roads Administration invited the port to join the reference group for assessing and identifying the measures necessary for how to improve ambient air quality in the Oslo and Bærum region to comply with the EC’s Ambient Air Quality Directive by 2020.
Finally, the city of Oslo, as with other major cities worldwide is experiencing rapid population growth, resulting in more people in urban and residential areas being exposed to harmful air pollutants.
This is a concern that the Port of Oslo is taking very seriously. By raising awareness of emissions and air pollution impact from the port to the public, the port believes that the provided information will contribute to positive dialogue with the public and obtain better air quality at the port in the process.
The inventory
To begin work on the inventory, the port used the DPSIR framework from the European Environmental Agency (EEA) which was applied to port activities with a bottom up emission inventory approach.
The components in the DPSIR framework are Driving forces, Pressures, State, Impact and Responses.
The process involved the port looking extensively at oceangoing vessels, harbour vessels, vehicles and cargo handling equipment. Port calls were used as the basis for calculating emissions from ocean-going and harbour vessels. Commercial actors operating at the port were involved in gathering emissions on shore.
Although this is certainly a rather time consuming approach it is necessary for identifying and collecting all emission data from port activities using fossil fuels.
Emission estimates for ocean-going vessels were based on three operating modes – sea, manoeuvring and at berth, while harbour vessel estimates were based on operating time.
For shore activities, figures for cargo handling equipment (CHE) were based on operating time and vehicles were based on operating distance.
The commercial ship register (World Shipping Register) was used for retrieving ship specifications.
Finally, necessary input data such as load factors and emission factors were identified though methodology published by US EPA (2009), European Commission and ENTEC UK Limited (2002) for ocean-going and harbour vessels.
The EMEP/EEA air pollutant emission inventory guidebook (2013) and “NO2-utslipp fra kjøretøyparken i norske storbyer, TØI (2011)” were used as the basis for load factors and emission factors for cargo handling equipment and shore traffic.
The Port of Oslo also coordinated and facilitated meetings and workshops with relevant operators for gathering emission data.
Initial results from the reference inventory of 2013 found that the ferry and cruise aspects of the port were by far the most polluting. At the top of the inventory was ferry emissions with approximately 265 tonnes of NOx, 6 tonnes of PM10, 91 tonnes of SO2 and 17,000 tonnes of CO2.
Cruise emissions followed behind in a close second with approximately 164 tonnes of NOx, 3 tonnes of PM10, 59 tonnes of SO2 and 11,000 tonnes of CO2.
After the inventory was conducted the information was then shared with the city.
Collaboratively a plan of action was then formulated which resulted in aiming to reduce 20% of road traffic volume in Oslo by imposing a speed reduction for highways and ring roads and increase 20% of electric and 5% of hybrid road vehicles. The 5% reduction of emissions from the Port of Oslo can be realised by:
- Effective container terminal management at Sjursøya for handling larger ships and fewer calls
- Continue Environmental Ship Index (ESI) incentive
- Develop guidelines for usage of LNG
- Introduce restricted parking facilities for private road vehicles at Port of Oslo
Moving forward
The forecast up until 2030 at the Port of Oslo allows for 50% growth in cargo and 40% growth in cruise and ferry.
The main approach the port will take to handle this will be to improve space efficiency and maximise efficient handling.
The AirQUIS software platform powered by Norwegian Institute for Air Research (NILU) and provided by PortsEYE is the air quality management tool used for structuring data in analysing and performing different scenarios for identifying optimal mitigation measures.
When it comes to cleaning up the most polluting aspects at the port – cruise and ferry – the port already has some initiatives in place, including the use of shore side power.
Color Line ferries (Color Fantasy and Color Magic) have been using shore power supply at berth since 2011/2012.
In the future, the port plans to put in place a common strategy to provide more shore power options for more foreign ferry lines.
It is also taking action in electrifying cargo handling equipment benefitting air quality and less noise.
The port will also be focusing on these drivers for its ship to shore equipment.
When it comes to replacing its RTG cranes, the port will focus on stack 5 containers, which use less space allowing for more efficient storage and cargo handling, and the new ship-to-shore cranes can lift two containers in a single operation.
Another aspect the port will be focusing on will be promoting the Environmental Ship Index (ESI) as a voluntary incentive programme for ocean-going vessels.
It will also discuss new steps to make the whole container handling chain greener including the use of electric trains, electric cargo handling and strategies for handling larger ships.
And it will restrict parking space in the port just like in the inner city to speed up traffic flow and reduce the risk of congestion.
Key to the smooth running of the whole of Oslo’s sustainability plan going forward will be the use of key performance indicators to keep the port on track with its efficiency goals.
Related Articles
 ALTERNATIVE FUELS GREENPORT
 NEWS
NEWS