






Managing and monitoring fugitive dust emissions
Sef van den Elshout* and Ernest Vrins* explain how fugitive dust emissions can be managed and monitored in a port area using real-time particulate matter measurements
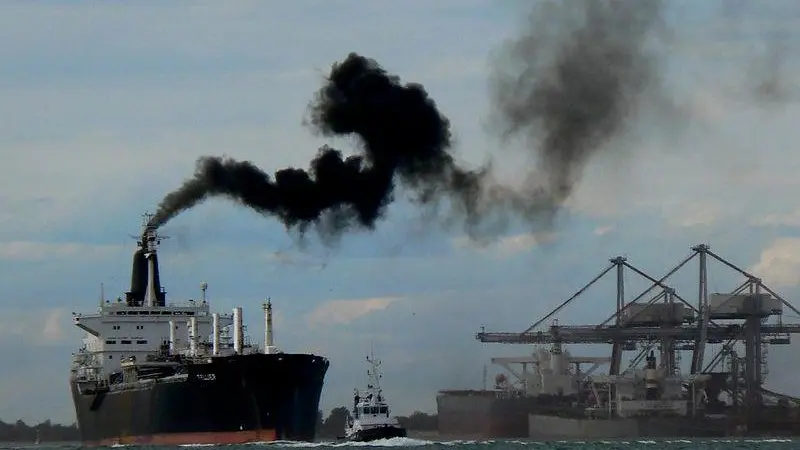
Fugitive dust emissions, from coal and iron ore storage and handling sites in the port of Rotterdam in the Netherlands, cause nuisance in residential areas due to dust deposition, and add to the particulate matter (or PM10) concentration. PM10 year average concentrations in the western part of the port, where most of the transhipment and handling of coal and ore is located, tend to be close to the limit values mentioned in the EU directives on ambient air quality. In particular the maximum number of days (35) with a daily average concentration > = 50μg/m3 appears to be a criterion that is hard to meet. In order to maintain/improve air quality standards for the population concerned and to accommodate further economic development for both the industries concerned and the port activities in general, detailed knowledge and careful management of PM10 emissions is necessary. Emissions from road traffic and processing industries are relatively well known. However, PM emission data from shipping and the storage and handling of dry bulk show considerable uncertainties. For shipping this is due to the large variety of ships (size, age, fuel used). In the case of the storage and handling of dry bulk, emission factors have been derived for the combination of products handled and techniques used based on the US-EPA and Dutch studies. However, the actual emissions often depend as well on highly variable parameters such as wind speed and the carefulness of the handling (e.g. sufficient lowering of grabs before opening, maintaining adequate moisture levels of stored ore, etc), and the appropriateness of the emission factor in view of technological advances. The fact that actual emissions are poorly known poses problems both for general air quality management as well as for the operational management of the facilities.
Air quality assessment and management
Managing local PM10 concentrations can be a rather frustrating affair. The local anthropogenic sources contribute to less than one third of the ambient concentrations, even in the port industrial area of Rotterdam. Emissions from high stacks (50-200m) contribute locally only a few percent and the emissions from sea-going ships are not under control of the local authorities. In the western part of the port, fugitive emissions are a sizeable part of local PM10 emissions and they are regulated by regional authorities. Furthermore, the emissions occur at a low height (0-25m) causing substantial concentration contributions in the surroundings. It is therefore very important to understand them. First, to understand the likeliness and extent of the PM10 limit value exceedences (by modelling the dispersion of the emissions). Secondly, to assess the potential benefits from abatement measures. In view of the importance of fugitive dust in this area, the use of standard emission factors per ton of product that was manipulated has proven problematic. Local operators have invested, and continue to invest, in emission reduction while their turn-over of product grows. However, the use of emission assessments based on a standard emission per ton of product handled, as for example in the Dutch Emission Registration, leads automatically to a rise of estimated emissions if the turn-over grows (see Box 1). As a consequence the environmental track record of a company is underestimated and the preparedness to invest in emission reduction is reduced: the results of those investments are not evident. At the same time the use of the wrong emissions leads to overestimated environmental problems if air quality assessments rely heavily on modelled concentrations. Estimating fugitive dust emissions, particularly for the bigger sources, should ideally be based on measurements. In the case of these diffuse emissions this implies that they have to be derived from inverse modelling of ambient concentrations in a dust monitoring network surrounding the facilities. In fact, the net reduction of dust emissions from one facility (despite growing turn-over) could be documented using the historic database of ambient TSP measurements of DCMR, the regional EPA.
Operational site management
The bulk terminals have implemented a range of emission abatement techniques. The effectiveness of most of these measures depends on the rigour and precision with which the prescribed activities are carried out. Environmental managers have to supervise their staff to check if work instructions are being followed. A crude monitoring method (available only during daytime) is the visibility of dust plumes. An ambient air quality monitoring network based on fast responding equipment surrounding the facility provides a more reliable and around the clock check on the performance of the emission prevention techniques. The fugitive dust-monitoring network described here was primarily designed for decision support on the storage and handling sites to prevent peak emissions causing nuisance in residential areas. It is further assumed that an effective permanent emission monitoring system would add to improved implementation of the emission abatement measures in general and hence to a reduction of overall emissions. *Sef van den Elshout is from DCMR Environmental Protection Agency Rijnmond (sef.vandenelshout@dcmr.nl) and Ernest Vrins is from Vrins Luchtonderzoek (ernest@vrins.nl)
Box 1. Evolution of estimated and “measured” PM10 emissions
In 1996, one of the terminals reported a PM10 emission of 485 ton/year, based on ambient measurements and the dust monitoring campaigns by Vrins Luchtonderzoek. Total handling of coal and ore in 1996 was approximately 50 million ton. In 2003 the terminal handled 20% more with a “measured” (based on reverse dispersion modelling from one TSP monitoring site) PM10 emission of 203 ton. Using constant emission factors combined with the growing turnover, the terminal emission was estimated at 609 ton/year in 2003. After negotiations with the Dutch Emission Authority the emission factor was revised. In 2008 the Dutch ministry for the environment started a research exploring the use of monitoring data obtained from systems as the one described here to further refine the emission factors. Results are expected in 2009.
Emission assessment of fugitive dust
In 1996 and 1997, a study on the coarse dust emission of the storage and handling sites in the port of Rotterdam was carried out by the Technical University of Delft. For several months, coarse dust (particles >10μm) was sampled by Coarse Dust Recorders. Over 10,000 hourly measurements of the coarse dust concentration (μg/m3) and particle size distribution were made at eight different receptor sites. The emission rates were assessed by reverse dispersion modelling. The measured dust concentrations consist of the contributions of the local dust sources and possibly background sources. The connection between the emission of a source and its contribution to the dust concentration is determined by the dispersion factor. The dispersion factor depends on the weather conditions, such as wind speed and wind direction and local conditions (distance source-receptor, roughness length, particle size). The dispersion factors are calculated, using the Fugitive Dust Model – FDM (USEPA), for every hour, every particle size class and every combination of source and receptor. The dust emission rates of the various sources were calculated by multiple regression, including those of the dry bulk terminals. Subsequently, the contribution of these companies to the dust deposition in the surrounding area was calculated. More insight into the origin of the dust emissions was acquired by evaluating the effect of variables such as wind speed, handling activities and traffic intensity. This information helped in the choice of the most effective dust reduction measures. This earlier study provided the appropriate information for a dust reduction policy. However, the monitoring methods used produce results, which are only available off-line, after completing the measurements. They cannot be integrated into a real-time supervision system of the sort that makes it possible to intervene when dust emission rates increase. This is only possible using fast responding equipment providing real-time information.
Monitoring network for
operational support
Choice of dust sampler
The most important requirements of a real-time fugitive dust-monitor are: a time resolution of at least one hour, particle size resolution and real-time availability of the dust concentration data. Fine dust (PM10) monitors with sufficient time resolution are available and part of the fugitive dust is in this fraction. Furthermore, for regulatory purposes the PM10 fraction of fugitive dust is the more important one. Monitoring this fine fraction can be used as an indicator of the coarse fraction when their ratio is known. The Osiris dust sampler suited our purpose. The Osiris operates on the principal of light diffraction and has a virtually constant response, irrespective of the colour of the particles. This small sampler (0.2m x 0.2m x 0.5m) gives a continuous and simultaneous indication of the PM1, PM2.5, PM10 and TSP mass fractions. Due to the low sampling rate (0.6 litres per minute), the sampling efficiency for large particles decreases. What is called TSP (Total Suspended Particulate) is actually about PM20 and, probably, the sampling efficiency depends on wind speed. Therefore, data analysis focuses on the size fractions PM2.5 and PM10.
Lay-out
To distinguish the contribution of a particular dust source from that from other sources, both the upwind and downwind concentrations must be measured. As the wind direction changes continuously, at least three samplers are needed around each dust source under investigation (Figure 1). Dust is measured every fifteen minutes by each sampler. Thus, at every terminal, twelve dust measurements are available for an hourly estimate of the dust emission rate.
Table 1. Correlation coefficients R2 between receptor sites (size fraction <2.5μm)
south of EMO west of EMO north of EMO
south of EMO 1 0.78 0.84
west of EMO 0.78 1 0.80
north of EMO 0.84 0.80 1
Results
Background concentration and contribution of EMO terminal
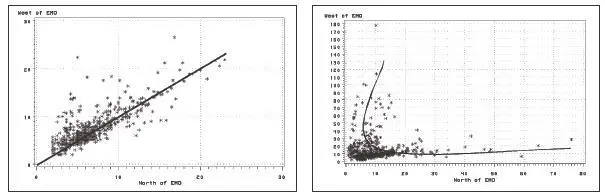
The background concentration is defined as the contribution of local and more distant sources outside the industrial site under investigation. Mostly, the exact origin of this contribution is not known. The contribution of background sources is best shown by comparing the dust measurements at different receptor sites. When these dust concentrations are dominated by background sources, the concentrations are highly correlated, that is the correlation coefficient R3 is close to 1. However, when the dust concentrations are caused by a dust source located in between the receptor sites, the correlation is very low. Table 1 shows the correlation coefficients between the receptor sites for the size fraction <2.5μm (PM2.5). The correlation between the sites is quite high. This means that the measured PM2.5 mainly originates from background sources. This is illustrated by Figure 2 where the PM2.5 concentrations west of EMO are plotted against the PM2.5 concentrations north of EMO. As the simultaneous concentrations at both sites are almost equal, the contribution of the terminal in between is relatively low. The correlation coefficients between the receptor sites for the size fraction 2.5 to 10 μm are much lower, ranging from 0.02 to 0.22 (Table 2). Figure 3 shows the concentrations of this size fraction west of EMO plotted against the concentrations north of EMO. The large difference between the two sites shows that the terminal largely contributes to the concentrations measured. The fact that the EMO terminal mainly contributes to the size fraction >2.5μm agrees with the expectation that the dust emission mainly consists of fugitive dust.
Table 2. Correlation coefficients R3 between receptor sites (size fraction 2.5-10 μm)
south of EMO west of EMO north of EMO
south of EMO 1 0.15 0.22
west of EMO 0.15 1 0.02
north of EMO 0.22 0.02 1
Real-time fugitive dust-monitoring
Software was developed to monitor the fugitive dust emission of the terminal and its impact on the surrounding area. An example is shown in Figure 4. The screen is renewed every 15 minutes. On the left, the last six dust concentrations (size fraction 2.5-10μm) at the three receptor sites. Top right, wind speed and wind direction, used for calculating dispersion factors. In the main figure, the current dust plume. An alarm can be set to go off when a certain value is exceeded. The real-time monitoring system is meant to provide the plant operators with the necessary information to intervene when dust emissions are rising and nuisance is likely to occur in the nearby villages. The system is part of the recently renewed environmental licences of both terminals. Previously the control of excessive emissions relied on visual inspection, a poor tool, especially at night. The monitoring system is expected to reduce peak emissions and thereby reduce the plants contribution to ambient dust concentrations. Since the start of the pilot in the Port of Rotterdam an updated version of the system was installed at a terminal in the Port of Amsterdam. The terminal is surrounded by food processing industries that are concerned about coal dust menacing their products. Apart from on-screen alerts this system sends text messages in case incidents are expected. The readings of the monitoring network are shared, online, with neighbouring companies to improve confidence. Off-line analysis of the data will yield additional information to improve the existing environmental management guidelines in use at the bulk terminals and provide more accurate information on emission factors that can be applied at facilities with similar dust control management but lacking the on-line systems.
Dust control
The bulk terminals use various ways to reduce dust emissions. Applying crusting material to avoid dust being blown away from the storage sites has proven to be a very effective measure. The previously black coal fields get a greyish coating. If this is well maintained substantial emission reductions are achieved.
Acknowledgements
This article is based on a paper by Ernest
Vrins and Sef van den Elshout (2007). The
full paper with references can be found
at www.dustconf.com/client/dustconf/
upload/s7/vrins_nl.pdf. All pictures: EMO
Dry Bulk Terminal.
Related Articles
 REGULATION & POLICY GREENPORT
 REGULATION & POLICY GREENPORT
 REGULATION & POLICY GREENPORT