![PortStrategy[GreenPort]](https://www.portstrategy.com/wp-content/uploads/2026/09/PortStrategyGreenPort.svg)





Global port growth overtakes China
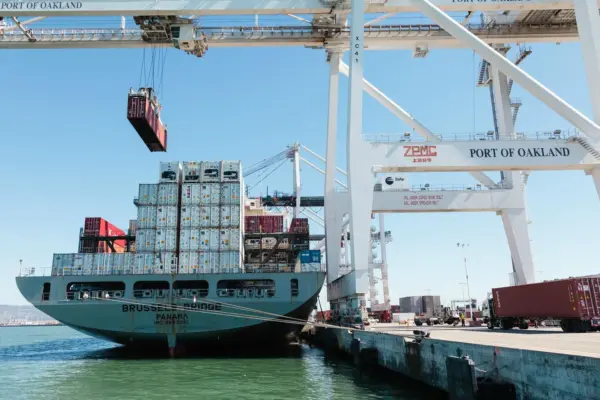
Cargo throughput at global ports grew faster than at Chinese ports over the first quarter of 2014, according to a report from Shanghai International Shipping Institute.

Global throughput grew by over 7%, significantly higher than in the first quarter of 2013, led by excellent handling figures from bulk ports. But Chinese ports have been hit by a drop in domestic demand and slowing global trade.
“In this quarter, [Chinese port] throughput of cargo for international trade increased by 8.7%, much better than the growth rate for that of domestic trade, which was only 3.5%,” said SISI. “However, as international trade only accounts for a third of total cargo throughput, it is not able to boost the industry as a whole.”
|
Ranking |
Port |
Q1 2014 |
YoY growth (%) |
Q1 2013 |
YoY growth (%) |
||
|
2013 |
Q1 2014 |
Change |
|||||
|
1 |
1 |
→ |
Ningbo-Zhoushan |
21,434 |
17.76 |
18,201 |
1.03 |
|
2 |
2 |
→ |
Shanghai* |
18,601 |
2.26 |
18,190 |
5.88 |
|
3 |
3 |
→ |
Singapore |
14,030 |
11.79 |
12,550 |
-4.96 |
|
6 |
4 |
↑ |
Qingdao |
12,291 |
5.04 |
11,701 |
13.98 |
|
4 |
5 |
↓ |
Tianjin |
12,093 |
3.98 |
11,630 |
7.01 |
|
7 |
6 |
↑ |
Tangshan |
11,867 |
11.92 |
10,603 |
25.12 |
|
8 |
7 |
↑ |
Rotterdam |
10,888 |
-0.22 |
10,911 |
-0.91 |
|
9 |
8 |
↑ |
Dalian |
10,839 |
5.44 |
10,280 |
11.28 |
|
5 |
9 |
↓ |
Guangzhou |
10,793 |
5.70 |
10,211 |
4.56 |
|
10 |
10 |
→ |
Yingkou* |
9,270 |
10.92 |
8,357 |
10.95 |
Q1 2014 Top 10 Global Ports Ranking (MT). Credit: SISI
Elsewhere, most European ports are showing signs of “stepping out of recession” and US ports also recorded improvement over the last quarter of 2013. However, Rotterdam was the only 100m-ton port that saw a year-on-year decrease in throughput in the first quarter 2014.
“In the eurozone, manufacturing PMI has been expanding during the past six months, and in March, consumer confidence index also reached a new high since the financial crisis,” said SISI. “As the European Central Bank adopted a low-interest policy, economic conditions in EU countries improved and most ports went back on a growing track, among which small and medium-sized ports saw huge expansion.”
European ports also enjoyed positive growth in container throughput for the first time in six years and while total throughput remains low, it is expected to “grow substantially”.
|
Ranking |
Port |
Q1 2014 |
YoY growth (%) |
Q1 2013 |
YoY growth (%) |
||
|
2013 |
Q1 2014 |
Chang |
|||||
|
1 |
1 |
→ |
Shanghai |
822.31 |
6.24 |
774.00 |
2.26 |
|
2 |
2 |
→ |
Singapore |
793.40 |
3.92 |
763.49 |
1.32 |
|
4 |
3 |
↑ |
Hongkong |
540.20 |
2.52 |
526.80 |
-2.81 |
|
3 |
4 |
↓ |
Shenzhen |
522.88 |
-1.09 |
528.62 |
4.25 |
|
6 |
5 |
↑ |
Ningbo-Zhoushan |
450.22 |
9.5 |
411.17 |
9.23 |
|
5 |
6 |
↓ |
Busan |
442.94 |
4.21 |
425.05 |
3.20 |
|
7 |
7 |
→ |
Qingdao |
415.35 |
6.08 |
391.53 |
11.45 |
|
8 |
8 |
→ |
Guangzhou |
357.83 |
12.44 |
318.25 |
-1.68 |
|
9 |
9 |
→ |
Tianjin |
317.43 |
5.81 |
300 |
8.34 |
|
10 |
10 |
→ |
Rotterdam |
290.57 |
0.26 |
289.83 |
0.72 |
Q1 2014 Top 10 Global Container Ports Ranking (MT). Credit: SISI
Related Articles
 CONCESSIONS & INVESTMENTS
 CONTAINER & CARGO HANDLING
 TERMINAL OPERATIONS