


CARRIER-STEVEDORE PARTNERSHIPS MARK INDUSTRY GROWTH
Drewry Shipping Consultants has released its latest port sector report, ” Annual Review of Global Container Terminal Operators 2004″ . The most significant effect on the league of global operators, according to Drewry, has been the increase in carrier-stevedore partnership arrangements.
This has seen both Mediterranean Shipping Company (MSC) and Cosco utilising their considerable interests in container shipping for greater terminal control.”Strategic partnerships have been the key to achieving growth for the two highest climbers in the Drewry league table in 2003.
In previous years, the top operators – Hutchison, PSA Corporation, APM Terminals and P&O Ports – have been able to develop the largest and most geographically widespread portfolios through M&A activity and greenfield developments, ” said the editor of the report, Eleanor Hadland. “MSC, on the other hand, has made the biggest leap forwards in 2003, leveraging its position as the world’s second largest shipping line to negotiate operating partnerships with many of its existing terminal service providers – for example SSA Marine in Long Beach and TN in Le Havre.” Drewry assesses that the combined terminal throughput of Cosco, and its part-owned affiliate Cosco Pacific, have also made significant progress during the past year, with volumes growing by over 50% during 2003 to 7.4mTEUs. This has been driven by strong growth at Chinese ports, where the majority of Cosco’s investments are located.
Partnership is also a preferred strategy for the company, which is working with other global operators in various joint-venture developments in China, for example with P&O Ports and APM Terminals at Qingdao. Most notably Cosco has also persuaded PSA to sign the first ever dedicated terminal agreement at Singapore. Drewry expects similar agreements to be made with other lines as the SE Asian operator seeks to protect its volumes from lower cost Malaysian competitors.Although Hong Kong based Hutchison Port Holdings has maintained its position at the head of the global throughput league table, reporting volumes of 41.5 million teu at its worldwide terminals in 2003, its 13% share of total world container port volumes is slightly down on the 13.3% share reported in 2002. PSA Corporation, which reported global handling of 28.7 million teu, also saw its market share fall from 9.5% to 9.1% between 2002 and 2003. 2003 has seen each company consolidate its leading position, for example by increasing their respective shareholdings in key European subsidiaries ECT and HesseNoord Natie.In contrast both APM Terminals and P&O Ports exhibited stronger growth over the previous year, 24% and 25% respectively, resulting in increased global market share.
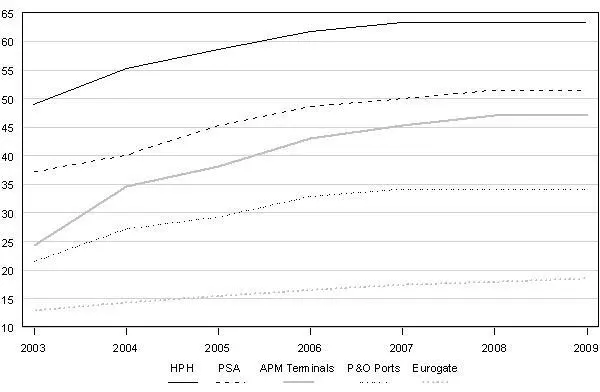
Looking forwards, the gap between the invested capacity of the top four operators and fifth placed Eurogate is set to widen over the next four years. HPH’s future investment plans continue to focus strongly on China, although it is also pursuing significant expansions in North Europe at Felixstowe, Harwich and Rotterdam. PSA is assessed as far more risk adverse than the other leading operators, having divested its terminal interests in both Aden (Yemen) and Pipavav (India) in the past year. Its future expansion plans focus on its home port operations in Singapore, and it will also invest in the Duerganckdok development at Antwerp.APM Terminals has continued to increase the proportion of third-party business handled at its terminals, and its forthcoming investments in China will improve the balance further in 2004. Whilst the portfolio is still broadly tailored to meet Maersk Sealand’s global terminal requirements, for example by providing strategically located and cost efficient transhipment hubs, these facilities are equally marketable to other carriers.
Even the recent small scale investments in Africa, Eastern Europe and the Middle East have appeared to target ports where congestion adds significantly to carrier costs, illustrating the achievable synergies between terminal and liner shipping operations. Although P&O Ports’ investment plans appear to lag behind those of APM Terminals approval of the London Gateway project in the UK would enable the operator to keep pace with its larger rivals, and certainly the company is still well clear of its next nearest rival Eurogate.China continues to drive the growth in global port throughput, and Drewry forecasts that by 2009 the Far East region will account for almost 40% of total world port volumes. Assessment of forthcoming port investment in the region reveals that demand will outstrip supply within 5 years unless additional projects are brought to fruition. In South Asia bureaucracy continues to reign supreme as operators struggle through lengthy concession bids.
Congestion is common at India’s major ports, and both terminal operators and carriers are looking to see if the minor ports have the potential to offer a better service package. Elsewhere, attention is now turning to the emerging Eastern European market to provide future growth opportunities – for example both Eurogate and HHLA are pursuing investments in Russia. In the USA the approval of two privately funded greenfield developments, by SSA Marine at Texas City and APM Terminals at Hampton Roads, is a significant departure from the leased terminal or common-user terminal arrangements found at most ports. Despite high barriers to entry new entrants to the league are emerging, with leading carrier CMA CGM taking an increased interest in port operations via its subsidiary Terminal Link, and the UK’s Mersey Docks and Harbour Company set to join the league next year following the award of the Beirut concession to its consortium’s bid.
“Annual Review of Global Container Operators (2004)” is published by Drewry Shipping Consultants Ltd.<$>www. drewry. co. uk
Global operators throughput league table, 2003(Million TEU / % share of world container port throughput) Rank Operator Million TEU % Share 1 Hutchison Port Holdings 41.5 13.1% 2 PSA Corp. 28.7 9.1% 3 APM Terminals 21.4 6.8% 4 P&O Ports 16.0 5.1% 5 Eurogate 10.8 3.4% 6 Cosco 7.4 2.3% 7 Evergreen 6.7 2.1% 8 DPA 6.5 2.0% 9 SSA Marine 5.4 1.7% 10 APL 4.9 1.5% 11 HHLA 4.6 1.5% =12 Hanjin 4.1 1.3% =12 Mediterranean Shipping Co. 4.1 1.3% 14 NYK Line 4.0 1.3% 15 OOCL 3.4 1.1% 16 CSXWT 3.1 1.0% 17 Mitsui OSK Line 2.9 0.9% 18 Dragados 2.5 0.8% 19 K Line 2.1 0.7% 20 TCB 2.0 0.6% 21 ICTSI 1.6 0.5% =22 P&O Nedlloyd 1.4 0.4% =22 Yang Ming 1.4 0.4% 24 Hyundai 1.2 0.4% 25 CMA CGM 0.6 0.2% Global operators total: 188.2 59.2% Notes: Figures include full year throughput for all terminals in which shareholdings above 10% were held as at 31st Dec 2003; due to the method of calculation some figures vary from terminal operators’ publicly announced results; some figures are estimated and some double counting occurs due to joint ownership structures.
Forecast development of capacity for top five operators, 2003-2009 (million TEU)
Source: Drewry Shipping Consultants Ltd.Forecast development of capacity for top five operators, 2003-2009 (million TEU)
Related Articles
 PORT & TERMINAL NEWS
 INSIGHT & OPINION
 PORT & TERMINAL NEWS