![PortStrategy[GreenPort]](https://www.portstrategy.com/wp-content/uploads/2026/09/PortStrategyGreenPort.svg)





Big numbers
The North Atlantic port region serves some of the most densely populated areas in North America and container growth is outperforming the national average. AJ Keyes assesses why this is a port region of ‘big numbers’
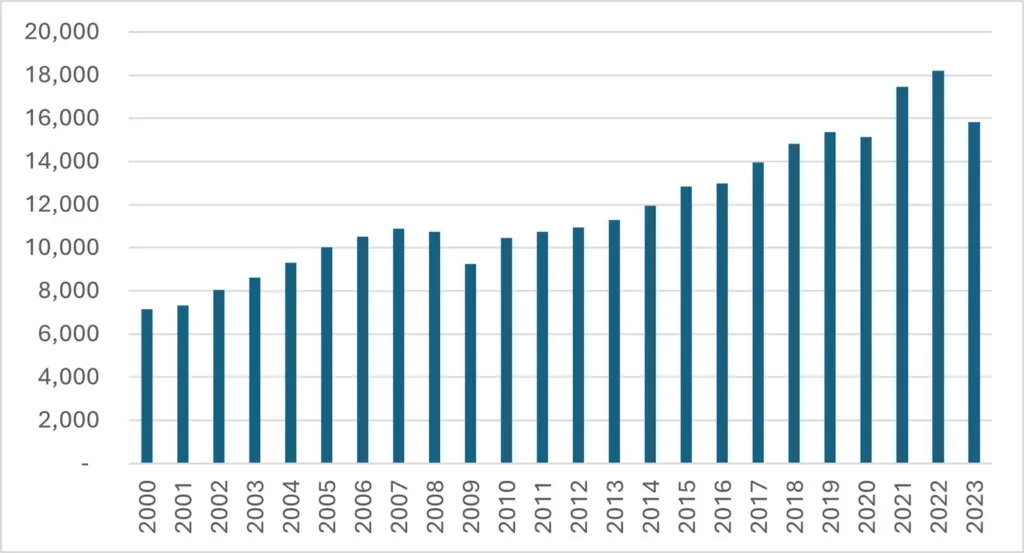
Container port volumes through the North Atlantic region of Canada and the US have grown by 3.7% p.a. between 2000 and 2023. This is above the national average for North America over the same period of 3.1%. So, who are the winners and losers and what does the future hold for ports serving this highly established, but important, region?
There are a wide range of established ports in this area, ranging from Montreal and Halifax on the East Coast of Canada, through the US Tri-State area including New York/New Jersey, and along the eastern seaboard to Philadelphia, Baltimore, and Virginia. To put the distance into perspective, sailing from Montreal to Norfolk (VA) represents almost 1700 nautical miles (according to sea-distances.org), so comprises a substantial area.
MASSIVE POPULATION NUMBERS
This region is also home to a massive consumer base, as Dean Davison, Head of Maritime Advisory at Infrata explains: “According to the US Census Bureau, the Tri-State area of New York, New Jersey and Connecticut is home to more than 20 million people, with Pennsylvania (12.9 million), Virginia (8.8 million) Massachusetts (7.1 million), Maryland (6.2 million), and the Montreal metro area (4.3 million), all contributing to a massive local market that North Atlantic ports must serve – and this is before the US Midwest population of almost 70 million is even considered.”
As Figure 1 shows, the ports that comprise this region handled a total of almost 7.15 million TEU in 2020, which has continued to increase until it reached 15.83 million TEU by the end of 2023. This is reflective of annual growth of 3.7% per annum.
The impact of the COVID-19 pandemic can be seen, with the 2020 total falling to 15.12 million TEU, down on the 15.35 million TEU for 2019 – and the end of continuous year-on-year growth that had been ongoing since the rebound from the Global Financial Crisis occurred in 2010 when 10.44 million TEU was recorded).
LAUNCHPAD
The recovery in 2020, in which the region’s ports saw a large increase to 17.47 million TEU as a result of supply-chain re-stocking, also continued into 2021 when 18.20 million TEU moved through the same ports, before a return to pre-pandemic levels for 2023.
Clearly, this is a launchpad for future, stable, port volume growth potential, similar to what occurred after the Global Financial Crisis in 2009, and which lasted throughout all of the last decade (as can be seen in Figure 1).
A breakdown of the long-term development of container volumes for ports in the North Atlantic region is shown in Table 1, covering the period 2000 through to the end of 2023.
The dominant volume position of New York/New Jersey is clear, confirming the port as having the highest throughput in the region. However, closer analysis shows that in 2000, the 3.05 million TEU handled represented 43% of the total regional port volumes, but by the end of 2023, this share had risen to almost 49.5% overall. Clearly, the big winner.
Elsewhere, Virginia has also seen an increase in market share over the same period, rising from 18.9% in 2000 to 20.8% for 2023, but the third largest volume port, Montreal has lost share, falling from 14.2% for 2000 to 9.8% by 2023. By comparison, Baltimore has maintained a consistent share, with the 2000 total of 7% almost identical at 7.2% by the end of 2023.
| Port | 2000 | 2005 | 2010 | 2015 | 2020 | 2021 | 2022 | 2023 | CAGR |
|---|---|---|---|---|---|---|---|---|---|
| Source: Ports, dataand.com | |||||||||
|
Montreal |
1,014 |
1,255 |
1,331 |
1,446 |
1,607 |
1,728 |
1,723 |
1,538 |
1.9% |
|
Halifax |
548 |
550 |
435 |
418 |
507 |
595 |
602 |
546 |
0.0% |
|
Other Canada |
159 |
218 |
172 |
222 |
245 |
250 |
260 |
275 |
2.5% |
|
Boston |
139 |
189 |
168 |
237 |
268 |
248 |
260 |
235 |
2.4% |
|
NY/NJ |
3,051 |
4,785 |
5,292 |
6,372 |
7,586 |
8,962 |
9,494 |
7,810 |
4.4% |
|
Baltimore |
498 |
602 |
611 |
840 |
1,052 |
1,023 |
1,069 |
1,138 |
3.8% |
|
Philadelphia |
199 |
205 |
276 |
428 |
641 |
739 |
791 |
780 |
6.4% |
|
Virginia |
1,348 |
1,982 |
1,895 |
2,549 |
2,813 |
3,522 |
3,703 |
3,288 |
4.1% |
With continued growth and substantial volumes across a number of the North Atlantic’s container ports, what plans are underway to keep pace with future demand? Read on overleaf…
Related Articles
 EQUIPMENT
 OPERATIONS
 OPERATIONS