![PortStrategy[GreenPort]](https://www.portstrategy.com/wp-content/uploads/2026/09/PortStrategyGreenPort.svg)

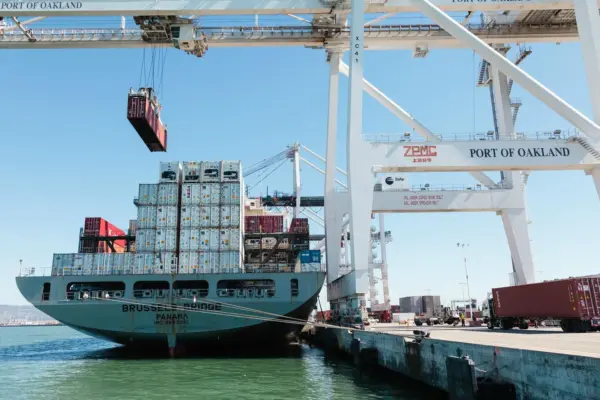
Port congestion indicators
QuantCube Technology has enhanced its merchant fleet tracking software to monitor congestion in thee of the world’s biggest ports.

The company has added real-time port congestion indicators to its QuantCube Macroeconomic Intelligence Platform to track traffic at Shanghai, Los Angeles/Long Beach and Rotterdam, providing an early warning of problems in global supply chains.
“Customers that already use QuantCube’s Global Trade data to understand changes in international trade, commodity trade, crude oil sentiment and automotive exports have been asking for greater insight into port congestion,” explained Thanh-Long Huynh, chief executive of QuantCube.
“A daily update is crucial for users operating investment strategies in this space – as the timeliness of the data is crucial in helping them spot trends ahead of the market.”
QuantCube combines real-time geolocation of the merchant fleet using AIS data with its own mapping of anchorage zones to measure the number of vessels waiting for a berth, as well as the average time spent in the anchorage zones before berthing.
Spikes in the indicators can suggest local pressures, such as Covid-19 restrictions, strike activity, storms or other disruption whilst sustained increases can signal systemic tensions in global and regional supply chains. This data can be used to both guide short-term strategies and the longer-term rebalancing of portfolios against inflationary risks.
The new set of indicators are available through QuantCube’s Macroeconomic Intelligence Platform, which also provides real-time indicators for inflation, tourism, global trade and key macro-economic variables.
Related Articles
 LEGAL, RISK & INSURANCE
 NEWS
NEWS
 PORT & TERMINAL NEWS