![PortStrategy[GreenPort]](https://www.portstrategy.com/wp-content/uploads/2026/09/PortStrategyGreenPort.svg)



Measuring a Port’s carbon footprint
The Ports of Oslo and Rotterdam presented case studies on their carbon footprint at the World Ports Climate Conference in Rotterdam.
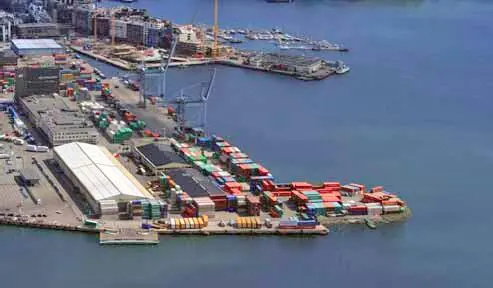
The carbon footprint of an organisation is the amount of greenhouse gases (GHG) that it emits over a reporting period (often a calendar year). The global standards for developing a carbon footprint are ISO 14064-1 and GHG Protocol. At the World Ports Climate Conference in Rotterdam in July 2008, the Ports of Oslo and Rotterdam presented case studies on their carbon footprint “To prove that the carbon footprint can be used for all type of ports (complex, small, big),” said the CEO of Port of Oslo Anne Sigrid Hamran at the conference, “we have chosen two ports – Rotterdam and Oslo – as examples for the methodology.”
|
Port of Oslo |
Port of Rotterdam |
|
120 hectares |
10 500 hectares |
|
6,400,000 tonnes |
407,000,000 tonnes |
|
185 000 TEU |
11,000,000 TEU |
|
6,300,000 pax |
(not registered) pax |
|
165 employees |
1200 employees |
Table 1: Ports comparison – Oslo & Rotterdam
According to Hamran, after establishing its carbon footprint goal, the organisation must calculate its footprint by using three scopes:
Scope 1 – operational control scope This states that organisation will calculate and take responsibility for those emissions that are under their day-to-day operational control.
Scope 2 – emissions from power stations These are emissions from power stations where they result indirectly from electricity demand of the organisation.
Scope 3 – the so-called “other indirect emissions”
These include emissions such as employee travel, outsourced activities and – for ports -very important activities including the movements of vessels and trucks, construction of quay walls and related activities.
“By using the footprint as a methodology the organisation can indentify in an efficient way the potential areas for emission reduction and costs savings,” says Hamran. “Also the carbon footprint can be used for other purposes, such as legal or financial risk assessments. The other benefit is that by using the footprint and carbon management, port can show to its stakeholders that the Port Authority is taking the responsibilities and possible discussions can be resolved in the early stage of environmental projects implementation.” Hamran notes that the establishment of a port’s first carbon footprint may take some time, especially when done by the Port Authority itself; and it may cost money, when done by consultants. But once a carbon management system is in place, time and costs will decrease. Hamran believes that, in the longer term, money spent on the footprint and the carbon management system is well spent. The project of calculating the carbon footprint gives an opportunity to use the existing data in a systematic way, supporting not only energy efficiency increase in buildings, but also offering a broader perspective of the Port of Oslo’s impact on climate. By calculating a carbon footprint the Port of Oslo will get detailed information about the sources of emissions. Based on this, the Port of Oslo can easier provide measures for reductions and create a reduction target for the years to come. The port of Oslo chose the operational control approach to be able to calculate the carbon footprint that can actually be influenced by the Port Authority.
|
Port of Oslo |
Port of Rotterdam |
|
|
Item GHG (in tonnes CO2eq) |
GHG-emissions 2007 (in tonnes CO2eq) |
|
|
Scope 1 |
456 |
8960 |
|
Scope 2 |
49 |
7230 |
|
Scope 3 |
199 |
20100 |
|
Total |
704 |
36290 |
Table2: Carbon footprint of Ports of Oslo & Rotterdam – Results
Related Articles
 ALTERNATIVE FUELS GREENPORT