Smart ocean bottom data means more detailed measurements are possible. While interest is clearly rising, the full potential is still largely unknown, writes Stevie Knight.
There is growing interest in accurate, highly detailed navigation charts, but as yet it is not widespread. As Nina Savijoki, Project Manager – Intelligent Sea, at Meritaito, (the state-owned company formed after the reorganisation of the Finnish Maritime Administration) says, “we do not yet have a full picture of its (smart ocean bottom data) potential.” This is proving a limiting factor.
This view is endorsed by Caroline Levey, Operations Director, OceanWise, (an independent company specialising in all aspects of marine environmental data), who confirms that uptake has been “patchy” simply because “people are not aware of what it can do for them - or even that it’s possible”.
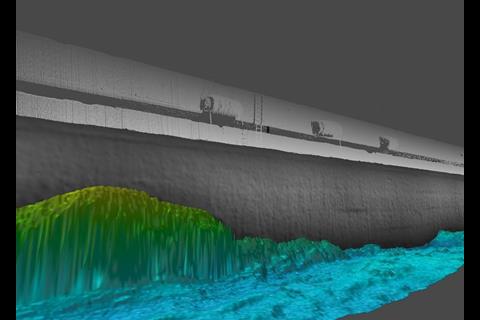
Viewed on a web-portal, the 3D models now available are impressive and nothing like the usual flat, wide-spaced, contour lines and rough landside approximations of a standard chart. Despite that, UKHO, Traficom and other electronic nautical chart (ENC) providers are not being left behind as services offered by Meritaito, OceanWise and others include formats that can be validated and incorporated into Electronic Chart Display and Information System (ECDIS). The concept is of particular interest to ports in the Gulf of Finland, “which often have difficult navigation challenges that can put the ship in close proximity to rocky outcrops or boulders”, says Savijoki’s colleague, Hanno Kurtti. Levey further explains where benefits exist: “With a greater level of detail, you can expand the tidal windows, allowing you to see how to bring more ships through the port.” There are advantages to locations with draft restrictions. “Accurate risk information can open up a port with loading limitations,” says Atte Rotko, a specialist independent consultant.
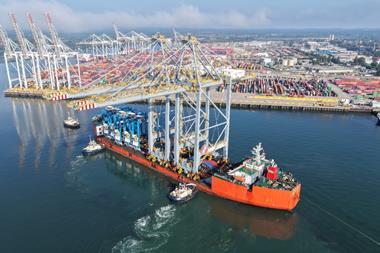
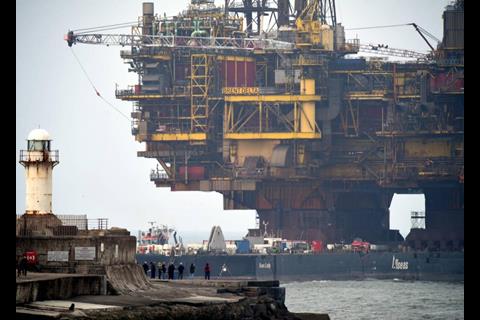
There are other potential uses too. For example, the Finnish port of Naantali is planning to scale-up the volume and frequency of ship calls to consolidate its position as a freight hub for Scandinavian markets – but that’s against ever-present competition from larger European players. Hence the port, which is part of the EU-funded Intelligent Seas pilot project, is going one step further. Meritaito is combining high-density bathymetric models of the port with information from a series of ‘smart buoys’. These floating and landside navigation aids (monitored and controlled from a web-portal) continually track everything from environmental markers to weather, current and accurate tide and sea-level data. As a result, both port and vessels gain real-time information. “Exactly how much water there is behind the propellers and beneath the hull is known,” says Savijoki. MEETING DIVERSE DEMANDS Demands are being pushed even further by oil and gas decommissioning, where the size and scale can be extraordinary. For example, Teesport in the UK was only able to take in the Iron Lady, loaded with the entire 24,000-tonne Brent Delta topside, because high resolution bathymetry made available to the pilots highlighted a viable route through to the Able UK yard at the end of its Seaton Channel. Interestingly, this level of detail also assists in answering more troubling requests. When the UK’s Clydeport received a call from a large, stranded ship the port knew it was urgent, “but it was a tight squeeze”, says Levey. Having accurate bathymetry allowed the tugs to bring the ship in – despite extremely narrow clearance margins.
However, these services also extend landward to the quay and even beyond that. The multibeam surveys can be tied together with LiDAR readings, yielding a seamless 3D model of port assets, explains Kurtti. Certainly, a quick virtual tour around Naantali shows not just the berth but electrical cabinets, water and waste points, bollards, ramps, cranes, and so on. “This speeds up cargo operations as the ship can optimise its position on the quay, straight from ECDIS”, points out Rotko. Further, Kurtti adds that relatively simple things like labelled plug-in points or showing agents where they can drop off supplies make the port a lot more accessible while easing the day-to-day administrative burden. PLANNING SIMPLIFIED It is not only about ship calls. The dense multibeam and laser readings get translated into easy-to-understand visualisations enabled for a web portal, making infrastructure planning and maintenance far simpler. Hitherto hidden vulnerabilities can also be revealed. For Naantali, one example involves an underwater pipeline running from the shore to a peninsula on the other side of the port. Since it turned through an angle its exact pathway had remained unknown, explains Rotko, at least until the models revealed all. However, these surveys also turned up a surprise – a small, previously undiscovered wreck that, though not a navigation hazard, will undoubtedly see future investigation. These bathymetric models also highlight requirements that need addressing immediately, helping ports to deploy resources effectively. It might not take much to make a difference. Naantali had bulk cargo remains built up against one of the quay’s footings and some remedial dredging regained depth alongside. Further, debris in the fairway can be an issue, “but this kind of bathymetric modelling also allows ports to consider where currents may move it,” says Savijoki. The combined underwater and landside visualisation enables port authorities and stakeholders to play with the possibilities. Rotko explains further, “It is a bit like a video game where you can move your view around between sea, land and air, and say ‘here’s where I might put my next structure’, and then look at the effects.
BUY IN OR GO-IT-ALONE? While Meritaito and its partners have developed an offering with regular re-surveys and ‘smart buoy’ deployment, there are a variety of approaches. Some ports will find a ‘one-off’ service suffices, and yet others may decide to keep the whole process to themselves. Of course, the cost of making it worthwhile depends on what the port is sitting on. Handing over raw data to ENC chart providers not only loses detail, these organisations are managing hundreds of charts, and simply might not be able to finalise the official update for a considerable period. Problematically, certain channels (especially those with sandy bottoms), can move dramatically in that time. “In the Dee Estuary, the main channel can move on an almost daily basis, so it is not possible for the National Hydrogaphic Office to produce charts at that speed, it can only be done locally,” explains Levey. Therefore, given an ongoing demand for accurate measurement, the software for creating a compatible ENC format might be a worthwhile investment even if it can be a five-figure sum – especially as this means these unofficial readings can be uploaded and made available on various mobile platforms in a matter of a day or so, with no waiting or loss involved. WHAT DOES THE FUTURE HOLD? The technology utilised in water-side operations is about to see a step change. The uptake of Portable Pilot Units – PPUs – has been rising ever since the kit moved from a bulky bag to an iPad app, but detailed bathymetry data is necessary to make the most of it. As one of the Tees Bay pilots involved in the Brent Delta operation notes, having this information available on the PPUs made “difficult, unexpected changes on the day” manageable. In Finland, Naantali’s project “is also helping build the foundation of the future,” says Rotko. As the country is a leading player in robotic solutions, that future will likely include autonomous vessels. Finferries is already testing out the supporting building blocks while Finnpilot is working steadily toward realising an e-piloting concept. Both will demand more than the traditional 2D charts can provide. However, “the real change comes in 2024 when new ECDIS devices, incorporating IHO S-100 features, are required onboard new vessels”, says Savijoki. That, in turn, is likely to give rise to further automation. As a result, she sees ships’ crew “potentially” handing over certain sections of the navigation to onboard computers. Indeed, asking vessel automation systems to recognise the fairway requires detailed bathymetry, but while current charts are accurate enough for the human eye they are not yet accurate enough for machines. “It may be a lot of small pieces,” adds Rotko, “but an ecosystem is slowly and surely building up” and a necessary part of that is an accurate, immediately available model of port infrastructure. However, right now, these additional capabilities allow a port to offer a new layer of digital services to its customers, making the operation both faster and slicker. “Considering the competition for calls, this does not hurt. Every hour counts,” concludes Savijoki.