


Time to be open about gate turnaround times
US ports are embracing a public appetite for port information and making truck-wait data available to all. Alex Hughes reports
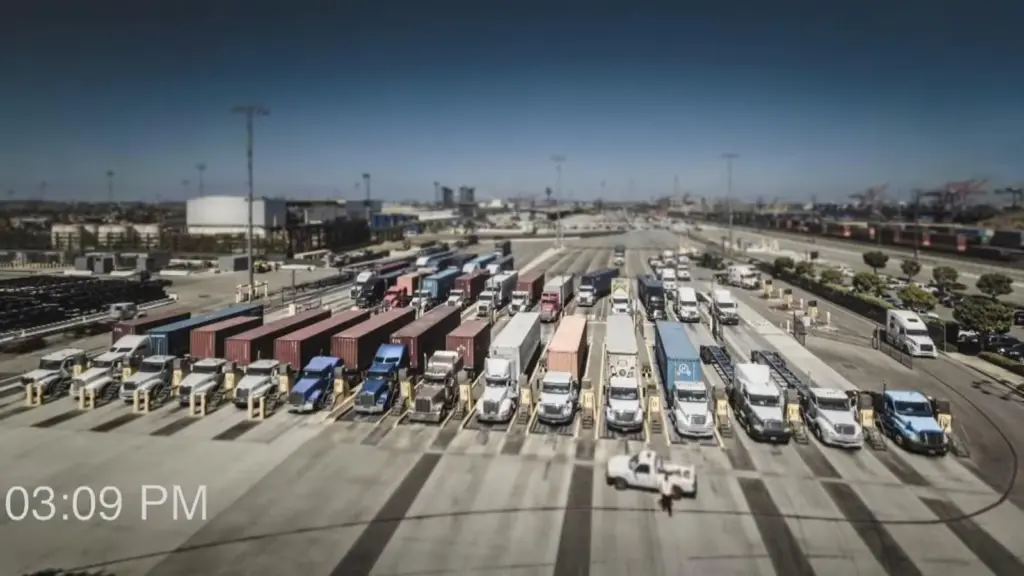
Can ports gain extra traffic from reporting truck turnaround times? US West Coast ports seem to think so.
The Harbor Trucking Association (HTA), of Los Angeles and Long Beach, first started publishing data on truck turnaround times in October 2013. According to chief executive Weston LaBar, up to that point such information had been purely anecdotal.
“Part of the problem was that a truck driver would say it would take four to five hours to complete a visit at any given facility, while the marine terminal would claim it was just 40 minutes,” says Mr LaBar, adding that it’s only with accurate data that you can take measurable action.
Prior to 2013, some marine terminals had published their pedestal-to-pedestal turn time information. But accurate information about turnaround times was being distorted by the random-access nature of operations in those days. Trucks, for example, could be forced to queue for several hours outside terminal gates, only to then complete their business within the terminal in fewer than 40 minutes – and it would be this latter information that the marine terminal would publish.
“In our view, it isn’t good enough to say you can get a truck in and out of the facility very quickly, if there is a queue outside first,” says Mr LaBar.
To gain more accurate information, the HTA therefore used telematics already in use in many of its members’ trucks. “It was that data that we then used to improve conditions,” he says.
Support was immediately forthcoming from the port authorities who had held off publishing data of their own, because they hadn’t wanted it to be construed as them adopting a combative position towards their tenants.
Financing and fences
The data collection programme is nowadays financed by the HTA, which recoups its investment through subscriptions. Some of the largest subscribers are port authorities, marine terminals and BCOs.
As for the data, geo-fences have been agreed with all maritime terminals to ensure that like-for-like data can be captured. Furthermore, Mr LaBar stresses that the data is statistically accurate, pointing out that in Southern California alone, HTA monitors over 5,000 trucks, which is half the number of frequent callers at the port, so the sample size is big.
Average monthly figures compiled by the HTA are also compared with similar figures gathered by the terminals themselves.
“Our two sets of figures are usually quite close. If there is a discrepancy of more than five minutes, we sit down and discuss why, but that rarely if ever happens,” he says.
The published figures have had an overall positive impact, with HTA having seen many efficiencies implemented with specific marine terminal partners as a result. However, Mr LaBar concedes that with just one port gateway publishing figures on the West Coast, it has been difficult to compare performance across different port operations.
“We therefore didn’t know whether the turn times of Los Angeles or Long Beach were good, bad or indifferent. As a result, even some of the more efficient terminals were receiving some negative pushback if the gateway as a whole was perceived as not being efficient,” he says. However, while he acknowledges that the two ports have some of the best terminals in North America, he candidly concedes they have some of the worst, too. But it’s only with the emergence of more data from other port complexes that valid comparisons can now be made.
The right path
Nevertheless, even with a lack of comparative data from other ports, data gathered by the HTA can be used to indicate whether Los Angeles and Long Beach ports are moving in the right overall direction.
“In fact, as a result of the figures, we have worked with individual marine terminals to put specific programmes together that have greatly reduced congestion,” he says.
As an example, he cites the YTI box terminal at Los Angeles, which initially had the worst turn times in the harbour, these being routinely over 100-120 minutes. Over the past few years, HTA has worked with YTI, using the data to look for improvements, and the terminal now has some of the best turnaround times in the harbour.
Mr LaBar stresses that, with good figures, terminals will attract both truckers and BCOs as their primary customers, which will in turn prompt shipping lines to switch alliances, too.
“Truckers and shipping lines tend to gravitate to terminals with the best gate productivity and when a terminal struggles to be efficient, it is hard to get truckers to call there,” he says.
So, while a cargo owner may look at ways to save money on ocean freight rates, they might find that this is negatively offset by the refusal of truckers to work with certain terminals because of their turn times. “Long gone are the days when you just tendered a load and got a price for it. Now, prices incorporate waiting time surcharges and congestion fees to ensure that, even if a terminal is not productive, a truck driver still makes money.”
Vessel growth
Mr LaBar says that, with space within ports nowadays at a premium, terminals are in a difficult position as vessel sizes continue to grow.
“If a terminal doesn’t have a fluid gate operation, it’s going to have a hard time accepting larger vessels. But terminals make money from volume so need to organise to accept larger vessels, which means more productive yards,” he says.
Indeed, the data published by HTA clearly shows that some terminals are having a hard time adapting to increased volume, while others routinely hit their target irrespective of the number of boxes being handled.
“If I’m a shipper with excess capacity that I need to send in a particular month, I can see that some terminals will be able to handle it better than others.”
Ports and terminals can therefore gain business if their turnaround times are good, with Mr LaBar singling out Long Beach Container Terminal as being recognised in the local trucking community for its ability to offer turn time of around 30-40 minutes, however much traffic it is having to cope with.
“In terms of productivity, shippers can see which terminals they should be sending their cargo to simply by studying published figures over time. These are the facilities that are investing in themselves and getting better, while others continue to have systemic issues.”
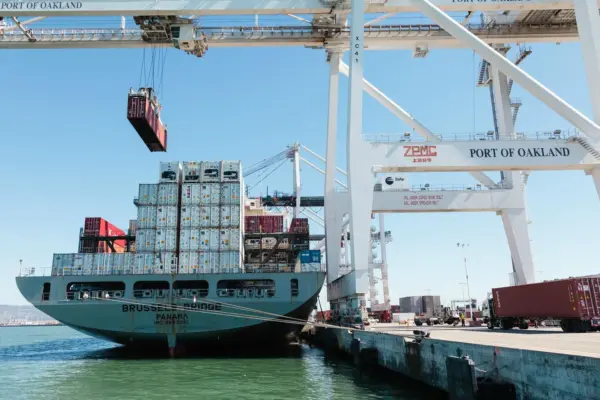
The Port of Oakland has heard the message and recently announced that it is to make truck turnaround times available through its online portal.
According to Mike Zampa, the port authority’s communications director: “Customer service is the driving force behind operational improvements at the port, including our latest improvement – turn time reporting. Shippers, freight haulers, dispatchers… so many parts of the supply chain benefit from a timely look at how marine terminals are performing.”
In terms of how accurate these figures will be, he says that Oakland is reporting average turn time information based on RFID reads transmitted from the marine terminals.
“Oakland marine terminal operators have been exceptional partners in all our improvement efforts, from extended gate hours to appointment systems. They’re supporting publication of turn times as well,” says Mr Zampa.
Supply chain gains
As to the impact that the availability of these figures will have, he points to an expected improvement of efficiency throughout the supply chain.
“Shippers can better plan for cargo deliveries, motor carriers can make more informed decisions about deploying drivers, and freight haulers can spend more time on the road by avoiding peak periods of terminal activity,” he says.
In some ports, either road hauliers or the actual terminals themselves publish truck turnaround information, but Oakland has opted to use its established internet portal to distribute this information.
“The goal of the portal is to provide everyone who touches the supply chain with a one-stop, unified view of the port online. By aggregating turn time metrics on the portal, we make it easier to track port-wide performance and provide an objective turn time metric,” explains Mr Zampa.
Interestingly, the reported turn times haven’t surprised port authority managers, since these have long been tracked offline through constant contact with the marine terminals. According to Mr Zampa, the figures now being seen online pretty well matched expectations.
“It’s too soon to say that turn times are shrinking as a result of the port’s new online metric, but the potential is there. Publishing the data could also point to areas of opportunity for future operational improvement,” he says.
Asked whether the availability of turn times will bring more business to Oakland, he reiterates that anything that improves port performance and efficiency has the potential to attract business.
“Our motivation is simply to improve efficiency and supply chain velocity for our customers and business partners,” he says.
Related Articles
 CONTAINER & CARGO HANDLING
 TERMINAL OPERATIONS
 CONTAINER & CARGO HANDLING