


Quay Crane’s Key Strategies
STS crane deliveries in 2025 reveal the high concentration of the sector and the very high dependence on Chinese manufacturers, which is not easily turned around.
By Fabian van der Poel and Johan-Paul Verschuure, Rebel Ports team
Ship-to-Shore crane deliveries are a reliable and tangible display of near future capacity shifts. Analysing crane deliveries gives another insight in the trends in the container industry. We analysed a dataset of 197 STS cranes deliveries to deep-sea container ports in 2025, using public news sources and terminal operator websites. The picture is one of continuing handling capacity expansion, Chinese manufacturing dominance, and a geographic centre of gravity shifting towards markets in South and Southeast Asia.
ADDITION OVER REPLACEMENT
The vast majority of cranes reported to be delivered are intended for expanding a terminal’s capacity. Using standard productivity benchmarks for STS cranes this means that around 35 m TEU of global handling capacity was expanded by the cranes analysed in dataset. The dataset represents roughly 2.5% of growth in installed handling capacity, relatively to an estimated rough 4% growth in global container handling capacity last year. With a part of the expanded container handling capacity coming from replacement by newer and larger cranes, as well as the use of Mobile Harbour Cranes (MHC) in smaller and multipurpose terminals, the analysed data set represents the majority of the new STS cranes.
The dataset only contains some 18 cranes intended for replacement, which is well below the expected number of cranes which should be replaced considering a lifespan of between 15-20 years. Either many of the cranes are stretched beyond this lifetime with extensive overhauls and replacement is postponed as much as possible, or replacing cranes is considered to be less newsworthy.
SOUTHEAST ASIA’S CRANE ELEVATION
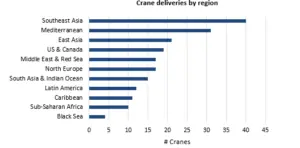
Considering the crane deliveries as a proxy of anticipated growth for the next few years, South East Asia remains the center of growth expectations (40 cranes). Growth is concentrated in Malaysia (13 cranes across multiple ports) and the Singapore Tuas buildout, highlighting the anticipated growth in transshipment over gateway volumes. With Durban taking care of most of the Sub-Saharan crane deliveries, the new operator is readying themselves for realizing the growth ambitions of the port.
Europe accounts for roughly 25% of the delivered cranes with 31 deliveries in the Mediterranean and only 17 in North Europe. Egypt is the standout story: the new Damietta Alliance terminal received seven HHMC cranes, while APM Terminals expanded at Port Said East, and APMT Barcelona began a five-crane expansion with three ZPMC cranes being delivered. North America adds another roughly 10% of the global crane deliveries.
LIFTING ZPMC’S GRIP ON THE MARKET?
In recent years there has been increasing talks about cranes from Chinese manufacturers. In early 2025 headlines indicated security concerns were raised in the US about cranes from Chinese manufacturing. Also the EU has signaled a more protectionist approach also highlighting security concern as key driver. This suggest significant changes for sourcing quay handling equipment. When considering an average lead time of some two years, the full effects of these trends are expected to work through in the deliveries in the next few years.
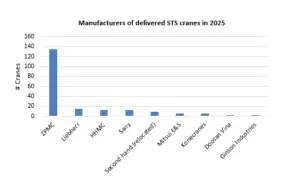
Analysing the 2025 data it clearly shows the strong grip of ZPMC on the market. Almost 70% of the cranes in our dataset were from ZPMC delivering globally. When adding the market shares of HHMC and Sany the share of Chinese manufactured cranes increases even further to above 80%. ZPMC however recorded even higher market share, further indicating the pressure on the sourcing of essential container handling equipment even before the 2025 turmoil.
The recently launched EU port strategy tries to ensure “a fair global competition for EU shipyards and equipment manufacturers”, which should even be achieved by potentially export financing and other sector specific tools. This means that the EU may not only be considering a more strategic approach to European ports, but also intends to export them outside the EU. Although the port strategy is not entirely concrete on the stimuli, a push to increase European manufactured cranes will however require much more than just funding mechanisms. Liebherr is a distant runner-up at 15 units (8%) and Konecranes and Kalmar jointly responsible for somewhat over 10% of the market. Although the strategy initially only writes about ‘fair competition’, coursing all European and American cranes outside China, would require the manufacturing capacity to grow by up to a factor of 3 at least.
SECOND HAND MARKET FOR CRANES
Only a very small share of crane deliveries involved second-hand cranes. Relocations included former APMT Pier 400 Los Angeles cranes finding a second life at Cai Mep in Vietnam. Also Kalmar seem to have focused on repair and relocation recently relocating STS cranes between Eurogate terminals. With container vessels gradually increasing in size across trades, it is interesting to witness that STS cranes are also not redeployed in line with the vessel upscaling. Terminals could consider buying larger equipment dealing with the higher and further lifting requirements of the larger vessels, and subsequently ‘cascading’ equipment down to other terminal.
Naturally the high transportation costs and risks involved with transporting cranes between terminals and commissioning/decommissioning costs play a role in this, but for new terminals or riskier expansions this may option could be further explored for optimizing the asset base and reducing investment risk. It would help if new cranes would be designed to be more flexible and transportable for this purpose.
APMT IN THE LEAD
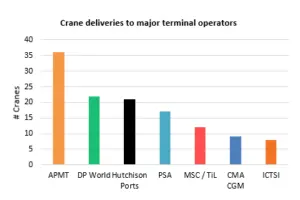
APM Terminals leads with 36 cranes across its wholly-owned and joint-venture terminals[1], reflecting APMTs strong recent extension of its terminal portfolio. DP World follows at 22, with most of its cranes being delivered along the China-EU corridor. Hutchison Ports and PSA International each received 19, with PSA’s intake concentrated at Tuas and Nhava Sheva. TiL received 12 cranes, including the expansions in Le Havre.
As such the crane delivery market is as concentrated as the shipping industry itself. If European policies are directed at increasing the share of European or American manufactured STS cranes, the headquarters of these international operator will need to be convinced. Given these operators are often non-European, strict policies and guidance will likely be needed to achieve the protectionistic objectives listed in the EU Port Strategy.
Recent protectionisitc and security ambitions around STS cranes will be very challenging to achieve for Europe and America. Currently the market share of non-Chinese manufacturers are well below the share in demand from European and American terminals. Especially when adding the higher replacement numbers from the older European terminals. Turning this around will not be done by just creating financing mechanisms or general ‘sector specific initiatives’. It will require a very extensive programme lifting the crane and equipment manufacturing industry across Europe. These type of industry policies have proved especially difficult to roll-out when only a few countries in the EU benefit. And only when also all yard cranes and other terminal equipment have had the same treatment, the objectives only might be achieved then.
[1] If cranes are delivered to a terminal shared by multiple operators, each operator will be attributed the total number of cranes delivered in this data cross-section.
Related Articles
 EQUIPMENT
 EQUIPMENT
 OPERATIONS