![PortStrategy[GreenPort]](https://www.portstrategy.com/wp-content/uploads/2026/09/PortStrategyGreenPort.svg)



CHINA: BALANCE OF POWER
Recent times have seen relatively small but distinct shifts in the balance of power among China’s containerports. A J Keyes charts these and puts northern China containerport development under the spotlight
For China as a whole, the container outlook is now much more complex than for many years. A combination of COVID-19 disruption and changes at the political level indicate that the future may look quite different from the situation over the past ten years. The degree to which the major ports can respond to these changes will be key to future growth rates.
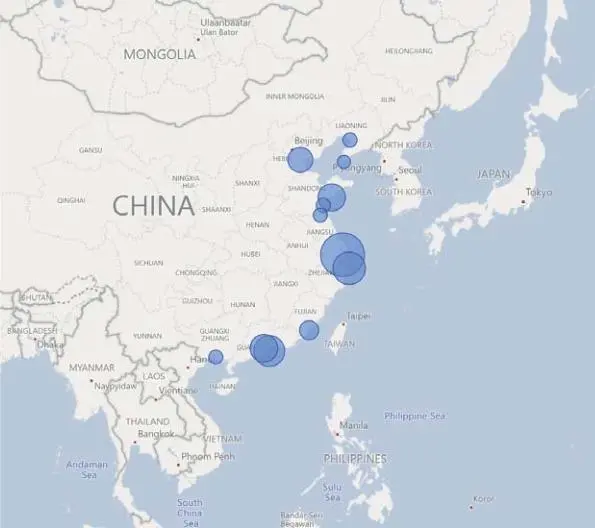
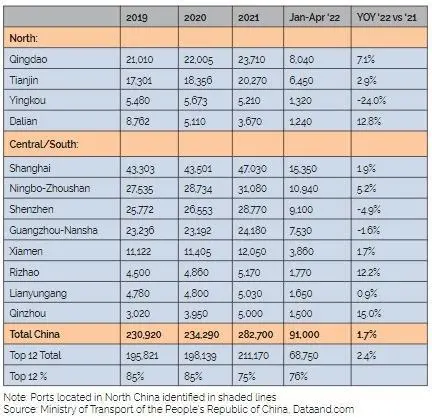
China has a number of largescale ports handling containers, which are geographically located in the north and central/southern areas of the country, as shown in Figure 1. Recent container volume activity is highlighted in Table 1, which outlines total container port volumes for China overall and individually for the largest 12 throughput ports between 2019 and 2021, plus for the January to end of April 2022 period (which is then compared to the first four months of 2021 in terms of percentage change).
There are some key conclusions that can be drawn here, notably, that China overall saw a substantial increase in containers passing through its ports in 2021, likely due to a rebound after the COVID-19 pandemic suppressed 2020 activity.
The dominance of the 12 ports listed is easy to see and the volumes handled are clearly substantial. In 2019, this grouping collectively handled 195.8 million TEU, which rose to 198.1 million TEU for 2020 and almost reached 211.2 million for 2021 – a rise of 6.2 per cent in 2021 over 2020 and 7.2 per cent for 2021 over 2019.
Yet possibly more striking is the decline in share retained by the largest 12 volume ports, down from 85 per cent in 2020 to 75 per cent for 2021. Shanghai was the biggest loser, seeing its 2019 share of total Chinese container port volumes of 19 per cent fall to 17 per cent by 2021. Likewise, other major ports of Ningbo-Zhoushan, Shenzen, Guangzhou-Nansha and Xiamen lost at least one per cent share.
A reduction in volumes moving to North America and Europe during COVID-19 being offset by greater Intra-Asia activity accounts for this shift with smaller ports in China serving regional routings benefitting.
However, for the January to end of April 2022 period, the leading 12 volume ports recorded growth of 2.4 per cent over the comparable four months of 2021, which compares to 1.7 per cent for China overall across the same period.
NORTHERN MOVES
A strong geographic location for serving Beijing and the largescale industrial heartlands of China in the north of country means that major container ports, predominantly meeting export demand out of Asia, have developed at Dalian, Qingdao, Tianjin and Yingkou and represent a sizeable share of the total national port market.
While the following article assesses this area in more detail, including looking at development plans and challenges moving forward, it is still possible to summarise that for 2019 these noted northern ports accounted for 23 per cent of the total China container market, which dropped to 22 per cent for 2020 and 19 per cent by the end of 2021.
This activity represents continuation of a recent trend in which Qingdao and Tianjin have been able to successfully increase volumes, but overall North China container port performance has been held back by container volume loss in Dalian.
Related Articles
 EQUIPMENT
 OPERATIONS
 OPERATIONS