Make hay while the sun shines is a famous phrase - while the Federal Government in Canada has deliberated the proposed Roberts Bank 2 project, AJ Keyes assesses if any competing port has taken advantage
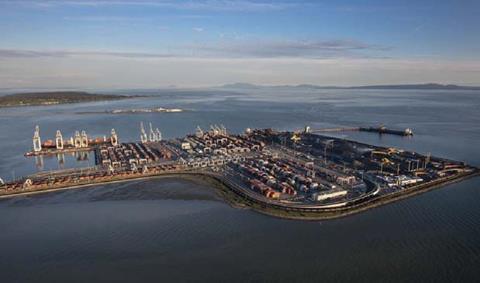
For the past 10 years, the Vancouver Fraser Port Authority (VFPA) has been waiting for the Federal Government in Canada to approve its longstanding Roberts Bank 2 development plan. This finally arrived in May 2023. So, the obvious question must be, have other ports in the Pacific North of North America taken advantage of this delay?
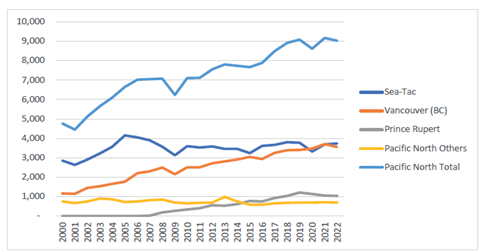
As Figure 1 shows, the Pacific North market has increased from almost 4.8 million TEU in 2000 to just over 9.0 million TEU at the end of 2022, growth of 2.9 per cent per annum. The drop in volumes for 2009 (Global Financial Crisis) and 2020 (COVID-19 pandemic) are noticeable, although there has been continued growth over the longer-term to confirm the importance of this gateway to North America.
CLEAR PATTERN EMERGES
Key port trends include the continued growth of Vancouver (1.2 million TEU in 2000 to 3.6 million TEU by the start of 2023), the emergence of Prince Rupert (over 1.0 million TEU in 2022) and Seattle-Tacoma (as the Northwest Seaport Alliance), handling 2.9 million TEU in 2000 and 3.6 million TEU last year.
However, if the period when the Roberts Bank 2 project was under environmental review is considered separately, a clear pattern emerges about which ports have been successful, as Table 1 shows. As a whole, the region has increased container volumes by 1.6 per cent per annum over the period, from 7.8 million TEU to just over 9.0 million TEU. However, at an individual port level, Prince Rupert has been the standout facility with its 7.6 per cent per annum growth, albeit that it had a lower starting point of 536,000TEU in 2013. Nevertheless, this DP World facility has still doubled its throughput in less than 10 years.
At the same time, Vancouver (BC) has also surpassed the regional average, recording growth of 2.6 per cent per annum over this same period, as its total throughput rose from just over 2.8 million TEU to almost 3.6 million TEU.
Yet by comparison the other major port in the region, at Seattle-Tacoma (which became the Northwest Seaport Alliance in 2015) generated growth of just 0.8 per cent per annum as its combined total rose from just under 3.5 million TEU in 2013 to just over 3.7 million TEU by the end of 2022.
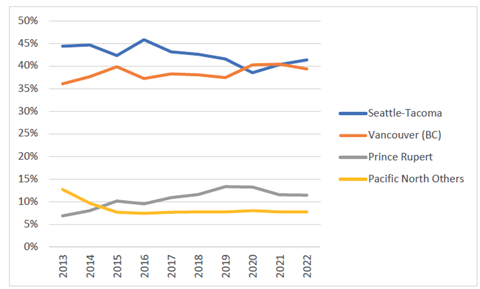
This assessment of total container port throughput provides an interesting snapshot that concludes the Canadian ports of Prince Rupert and Vancouver (BC) have an increased share of the market, whereas Seattle-Tacoma has seen only limited increases. Indeed, as Figure 2 outlines, in 2013 Prince Rupert accounted for seven per cent of the regional market, with this rising to 11 per cent in 2022, while over the same period Vancouver’s (BC) share improved from 36 per cent to 39 per cent.
By comparison, Seattle-Tacoma recorded a drop from 45 percent in 2013 to 41 per cent in 2022. Yet these numbers do not tell the whole story because in 2016 the Northwest Seaport Alliance was handling 46 per cent of all containers in the Pacific North, which subsequently fell, year-on-year, to 39 per cent in 2020. Indeed, it was only the congestion in Vancouver (BC) over the past two years that likely helped Seattle-Tacoma regain any lost share of regional container activity.
The other drop in share was recorded by ports classified as “Pacific North others,” which primarily consists of Portland, Everett, Anchorage, Dutch Harbour – all facilities generally specialising in smaller ships and regional activities, rather than direct deep-sea calls from Asia.
TARGETTING US MIDWEST
So, the volumes handled by ports in the Pacific North indicate that, generally, the Canadian ports have grown their throughput more successfully than their US counterparts. It is important to note that local hinterlands only play a small part in these ongoing trends. This is because all (major) ports are competing to serve the largescale US Midwest discretionary markets of Chicago, Detroit, and the Ohio Valley. Indeed, the ability to succeed in attracting this cargo is what strongly influences the success of the different facilities.
To be competitive in these US markets means providing sufficient infrastructure, especially as ships have continued to increase in size on the Transpacific. According to maritime advisory specialists, Infrata, at the start of 2012 the largest container ships on this trade route were generally no bigger than 6000TEU, whereas the position today reflects tonnage of up to 18,000TEU (although nearer 16,000TEU is more common in the Pacific North).
So, what have these ports been doing while the Federal Government in Canada deliberated? Well, despite Roberts Bank 2 being the long-term aim for VFPA to meet future container demand, there has been additional capacity generated by port operators, DP World and Global Container Terminals (GCT) at their respective facilities.
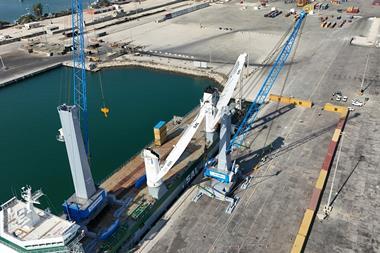
For DP World, the Centerm Expansion Project and South Shore Access Project commenced in Summer 2019 and a combination of expansion and reconfiguration resulted in a 60 per cent increase in capacity (from 900,000TEU per annum to 1.5 million TEU per annum) by adding just 15 per cent more land. Two new Super Post-Panamax cranes have also been added, with a 24-container row outreach.
GCT Vanterm, continues to undertake its Phase 1 expansion project that will see two new ship-to-shore cranes and 10 new RTGs added as part of a C$160 million investment to raise capacity to 582,000 lifts (an increase of 25 per cent) and to be able to handle 14,000TEU capacity vessels by the end of 2023. The Phase 2 component will increase capacity to 700,000 lifts per annum, up by 20 per cent, and operations could commence in 2026, with build out by 2029. Importantly, additional rail capacity is also planned, with over 50 per cent to be added, taking the total to 580,000 lifts.
At the same time, DP World also continues to expand Prince Rupert. In Q1 2022, the operator entered into a “two- year agreement to assess the feasibility of an innovative new container terminal project” with the Prince Rupert Port Authority. This second terminal would add a further two million TEU per annum capacity.
However, what is of real significance to Prince Rupert and the wider competitive region is the development of the Ridley Island Export Logistics Project (RIELP). Located on the southern end of Ridley Island, RIELP is designed to offer integrated large-scale bulk transload facilities, breakbulk operation, and off-dock container yard. Collectively, the platform is designed to support at least 400,000TEU per annum of export transload capacity annually, with the potential to increase capacity to 700,000TEU per annum.
This project, due for completion by 2025, according to the Port Authority, will provide a platform for transloading bulk commodities such as plastic pellets, cereal grains, speciality agriculture crops, lumber, pulp, and mineral concentrates to containers for export, with the off-dock facility ensuring empty container storage for the port’s container terminal operations. In short, it represents a potential game changer by helping to generate significant export traffic for the port, an appealing opportunity for shipping lines and railroad service provider, Canadian National.
Clearly, Canada’s Pacific North ports have been busy while the Roberts Bank 2 environmental review process slowly continued, but can the same be said of the US port complex at Seattle-Tacoma?
Well, the Terminal 5 modernisation plan at Seattle is the recent major infrastructure development. After completing the environmental process in 2015, ground was broken on the US$500 million, one million TEU per annum, project in 2019 and the facility was shut for container vessels. In Q1 2022, the first phase was completed, which included four new Super Post Panamax cranes. Phase two is currently underway and due for completion during 2023, resulting in 185 acres of extra space for Terminal 5.
Other projects at the port include an extra 500m of quay for Terminal 18 and expansion to Terminal 46, part of the Northwest Seaport Alliance’s plans to keep pace with larger ships in the Transpacific trades, which have grown beyond the capabilities of the older, smaller, individual facilities.
Such largescale investment projects, like Terminal 5, are needed for the port to remain competitive, but ultimately the desire of the US railroads to help win intermodal traffic for discretionary markets will be the key driver.
LESS INTERMODAL-INCENTIVISED
One port specialist in the region, who wished to remain anonymous, states that US railroad operators serving the Pacific North are “less intermodal-incentivised” than their Canadian counterparts. This is despite the Intermodal Association of North America (IANA) data showing that the long-term growthrate for international containers is growing in excess of three per cent per annum.
While not a large figure, it still reflects continued increases in demand for intermodal rail in a highly established market, that the Canadian railroads aggressively move to capture.
From a Pacific North port perspective, it is the ports of Vancouver and Prince Rupert that have benefitted over the past 10 years and are winning the battle for container cargo.
| 2013 | 2014 | 2015 | 2016 | 2017 | 2018 | 2019 | 2020 | 2021 | 2022 | CAGR | |
|---|---|---|---|---|---|---|---|---|---|---|---|
| Seattle-Tacoma | 3,462 | 3,456 | 3,246 | 3,616 | 3,665 | 3,798 | 3,775 | 3,320 | 3,696 | 3,736 | 0.8% |
| Vancouver | 2,815 | 2,913 | 3,054 | 2,936 | 3,253 | 3,396 | 3,399 | 3,468 | 3,706 | 3,557 | 2.6% |
| Prince Rupert | 536 | 618 | 776 | 754 | 927 | 1,036 | 1,211 | 1,141 | 1,058 | 1,036 | 7.6% |
| Pacific North Others | 990 | 750 | 589 | 586 | 650 | 687 | 700 | 690 | 710 | 700 | -3.8% |
| Pacific North Total | 7,803 | 7,737 | 7,665 | 7,892 | 8,495 | 8,917 | 9,085 | 8,619 | 9,170 | 9,029 | 1.6% |