



Emission assessment using auto-ID
Transponder technology is being used to assess emissions by seagoing vessels in the Rotterdam area. Rinkje Molenaar1, Kees van der Tak2 and Jan Hulskotte3 explain how the technology works
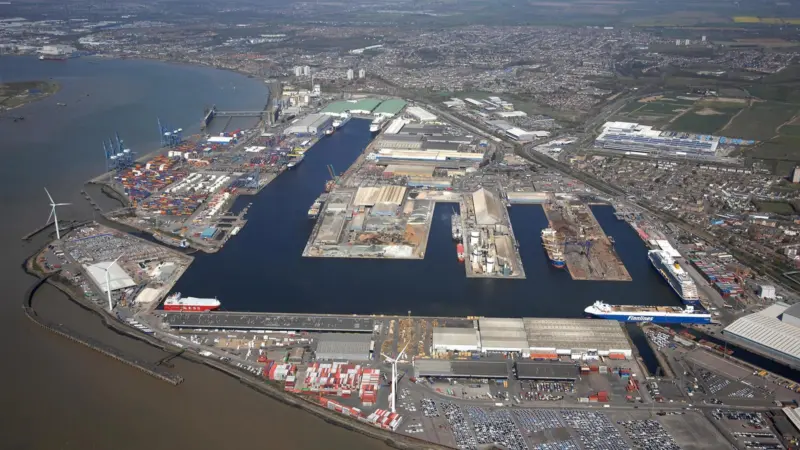
Rotterdam and its industrial port area, also called ‘Rijnmond’, is home to 1.2 million inhabitants, living very near to harbours, large waterways and industries (see figure 1). On the coast, several environmental protection areas exist (so called Natura 2000 areas).
The Netherlands has to invest much effort to meet the European standards for air quality and the Natura 2000 obligations for nitrogen deposition. The contribution of shipping emissions to the air pollution and the deposition in this region is substantial4. However, in comparison with other local sources such as road traffic and industry, the data about shipping emissions has not been comprehensive.
This article describes a successful method to calculate the emissions from seagoing vessels more accurately and with a high spatial resolution. This is required for detailed air quality assessment by modelling. The AIS (Automatic Identification System)-transponder signals, transmitted by each ship with a size of 300 gross tonnage or more, to report its position, speed and identity, are the key of this approach. MARIN (Marine Research Institute Netherlands) and TNO (Netherlands Organisation for Applied Scientific Research) have tested a new method to estimate shipping emissions in the Rijnmond region.
Analysis of transponder data
Ships transmit the transponder signals with a high frequency (more than once per minute). For this study the signals were analysed with an interval of two minutes. Based on the received information the accompanying emission was calculated.
First, the MMSI (Maritime Mobile Service Identity)- number and the speed were linked to the grid cell where the ship was located at the moment it sent the signal. Using the MMSI-number the ship could be traced in the LMIU-database that contains information about the ship type and relevant characteristics of the engine needed to make proper calculations. In the next step the emission in these two minutes was calculated for the specific ship (for details see next paragraph) and added to the grid cell.
Almost 85 percent of the sources of AIS signals could be identified in this way. The missing ones were mainly inland vessels, pilot boats, etc. which were outside the scope of this study. Depending on its speed a ship can pass more than one grid cell in two minutes. This leads to an overestimation in one cell and an underestimation in another. Because of the large amount of observations (45.5 million AIS-signals in the year studied) this will level out.
Calculation of the emissions
Sailing ships
For all ships with a speed above 1 knot, the method was used to calculate the emissions of hydrocarbons, sulphur dioxide (SO2), nitrogen oxides (NOX), carbon monoxide (CO), carbon dioxide (CO2) and particulate matter (PM10). The basis for the emission calculation is the so-called emission factor of the engine, expressed in g/kWh. This emission factor depends on the type and age of the engine in combination with the fuel type.
Previous studies by TNO5 determined the emission factor for the various combinations, assuming sailing at cruising speed. Speed, however, has a large influence on the energy-use, according to the formula: Energy-useactual (kWh) = Energy-usecruising speed (kWh) x (speedactual/speedcruising speed)3
This formula shows that energy consumption is a function of the third power of speed.
In this study the actual speed is known from the AIS-signal, so the energy-use can be calculated much more accurately. The engine characteristics are known from the LMIU-database and the used fuel type was deduced from the combination power and engine speed. With these elements the emission over the last two minutes was calculated for each AIS-signal and allocated to the right grid cell. The main uncertainty in this study is related to the use of the auxiliary engines, for which reliable information is lacking in the LMIU database.
ships at berth
Ships sailing less than 1 knot are supposed to be at berth. They send many transponder signals originating from the same location. Thanks to this new method the length of time at berth of the ships could be determined accurately. Surprisingly it appeared that this period was longer for almost all types of ships than previously assumed. The emissions for ships at berth were calculated based on ‘gross tonnage x time at berth’ and related to the ship type, as in the previous studies of TNO. Due to a lack of a good registration of the auxiliary engines and uncertainty about the fuel type used, the calculations of the ships at berth still show uncertainties. Supplementary research on this subject can be useful.
|
Component |
Sailing |
At berth |
Total |
|
Hydrocarbons |
142 |
209 |
351 |
|
Sulfur dioxide(SO2) |
1,101 |
2,339 |
3,440 |
|
Nitrogen oxides(NOX) |
3,296 |
4,551 |
7,847 |
|
Carbon monoxide (CO) |
953 |
925 |
1878 |
|
Carbon dioxide (CO2) |
141,379 |
490,837 |
632,215 |
|
Particulate Matter (PM10) |
173 |
266 |
438 |
Results
Table 1 shows the calculated emissions for the
Rijnmond region of the various pollutants for the year 2007.
The total emissions for the year 2007 based on the AIS-data appeared to be similar to the assessment for the year 2006 using the existing method, the so-called EMS (Emission registration and Monitoring of Shipping)- protocol6, implying that the total emissions calculated until now were a fair estimate. However we observed a shift from sailing emissions to emissions at berth and a different spatial distribution.
The main advantage of the new method is the accurate and very detailed allocation of the emissions as is shown in Figure 2 for the NOX-emission.
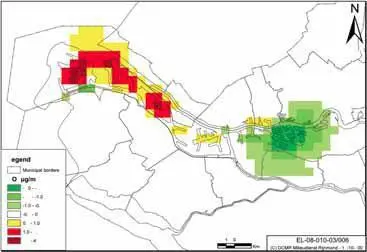
The spatially detailed emissions are the basis for modelling the air pollutant concentrations attributable to seagoing ships. Comparing the concentrations based on the old and the new spatial emission pattern reveals that the previous spatial distribution is no longer accurate. In the course of time port activities in Rotterdam have moved further west and the importance of the harbours near the city centre is diminishing. This phenomenon was apparently not sufficiently accounted for in the existing emission inventory. The relocation of the emissions has important consequences for the assessment of the air pollution concentrations in the city centre: they were previously overestimated. Towards the coast (and the Natura 2000 areas) the emissions were previously underestimated. Here you can see the results of model calculations of nitrogen dioxide attributable to seagoing ships for the year 2010 (by DCMR and Royal Haskoning). Figure 3 shows the difference between the contribution of sea going vessels calculated by the new AIS-method and with the existing method for the year 2010.
The concentration difference in the urban area is up to 10 percent of the national (and EU) limit value for nitrogen dioxide (40 μg/m3). This is substantial in view of the difficulties faced in achieving the limit values. All over Europe cities are performing modelling exercises to assess their air quality and to analyse their options to abate pollution. High quality input data is essential in these studies. Updating the shipping emission inventory by mapping and re-assessing the emissions improves the air quality assessment in Rotterdam.
Conclusion
The use of AIS-transponder data in a pilot study improved the understanding of the impact of sea going vessels on the air quality in Rijnmond substantially. The method will be extended to the other Dutch port areas as well as the Dutch part of the North Sea and become the new standard approach. A similar approach for inland waterway shipping would be very useful as well. These emissions are also characterised by considerable uncertainty about the location and the amount of emissions. However at this moment only a small part of the inland waterway vessels are equipped with a transponder. Legislation obliging the use of a transponder for these category of ships too is expected within a few years. The pilot study was paid for by the Ministry of Transport Public Works and Water Management, Netherlands Environmental Assessment Agency and DCMR Environmental Protection Agency Rijnmond.
1 DCMR Environmental Protection Agency Rijnmond (rinkje.molenaar@dcmr.nl)
2 MARIN (Marine Research Institute Netherlands)(c.tak@marin.nl)
3 TNO (Netherlands Organisation for Applied Scientifi c Research)(jan.hulskotte@tno.nl)
4 The contribution of seagoing vessels to the local NO2-concentration in the city of Rotterdam can reach 25percent and near the coast up to 50percent.
5 Oonk, H., Hulskotte, J., Koch, R., Kuipers, G. and Van Ling, J. (2003). Emissiefactoren van zeeschepen voor de toepassing in de jaarlijkse emissieberekeningen (Translated from Dutch: Emission factors of sea going vessels used in the calculations of yearly emissions), TNO report: R 2003/438.
6 Recently described in English: Van der Gon, D. and Hulskotte, J. (in press). Methodologies for estimating shipping emissions in the Netherlands. A documentation of currently used emission factors and related activity data, PBL Report 500099012, ISSN1875-2322
Related Articles
 ALTERNATIVE FUELS GREENPORT